Part 2 | Multivariate EDA
> summarize relationships between variablesWe'll explore how variables relate to each other through scatterplots, grouped comparisons, and conditional analysis. This is where data starts telling richer stories.
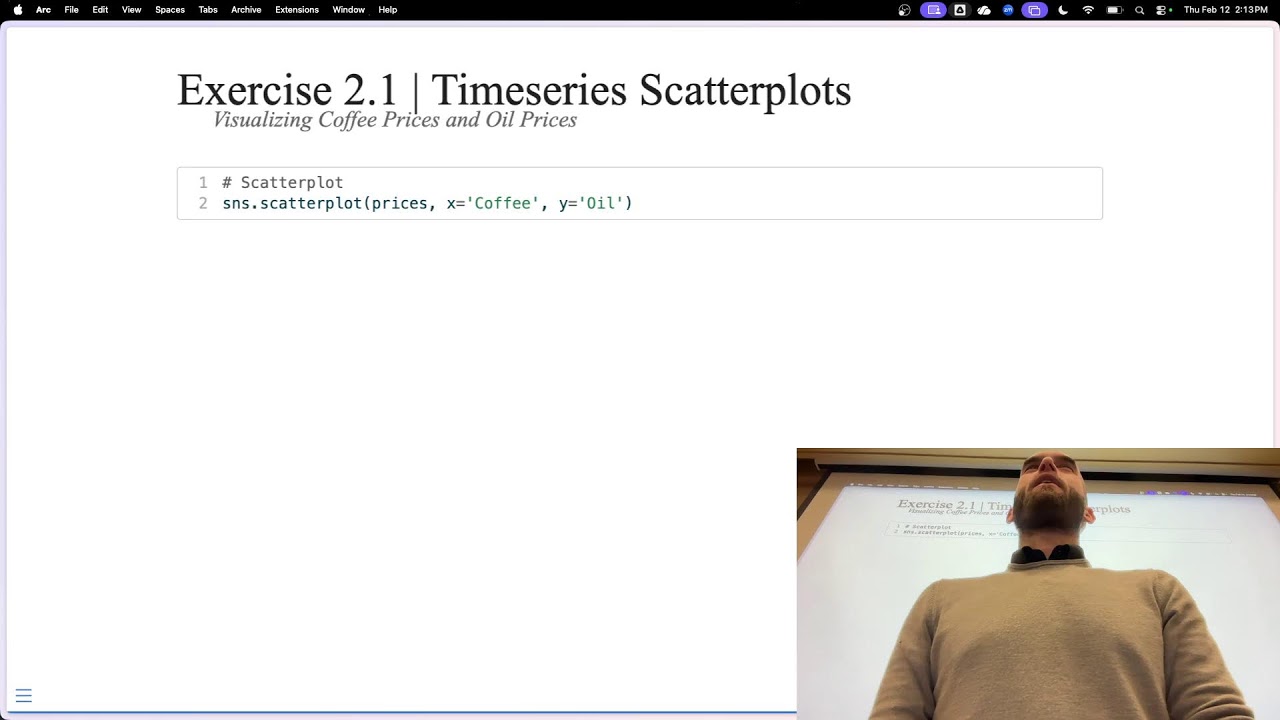
Part 2.1 | Numerical × Numerical
Visualize relationships between numerical variables. Anscombe's Quartet shows why we visualize. Scatterplots for two variables; bubble charts and color encoding for three or more.
Livestream 2.1
Class recording on February 12, 2026
Concept 2.1 // Bivariate Data
Anscombe's Quartet; scatterplots; size and shape encoding with bubble charts.
Part 2.2 | Numerical × Categorical
Compare a numerical variable across categories. Grouped boxplots show how distributions differ by group.
Livestream 2.2
Class recording

Concept 2.2 // Grouping Data
Compare distributions across categories with grouped visualizations.
Part 2.3 | Numerical × Numerical × Categorical
Does a relationship differ across groups? Use color and faceting to compare scatterplots by category. Filter data to focus on specific subgroups.
Livestream 2.3
Class recording
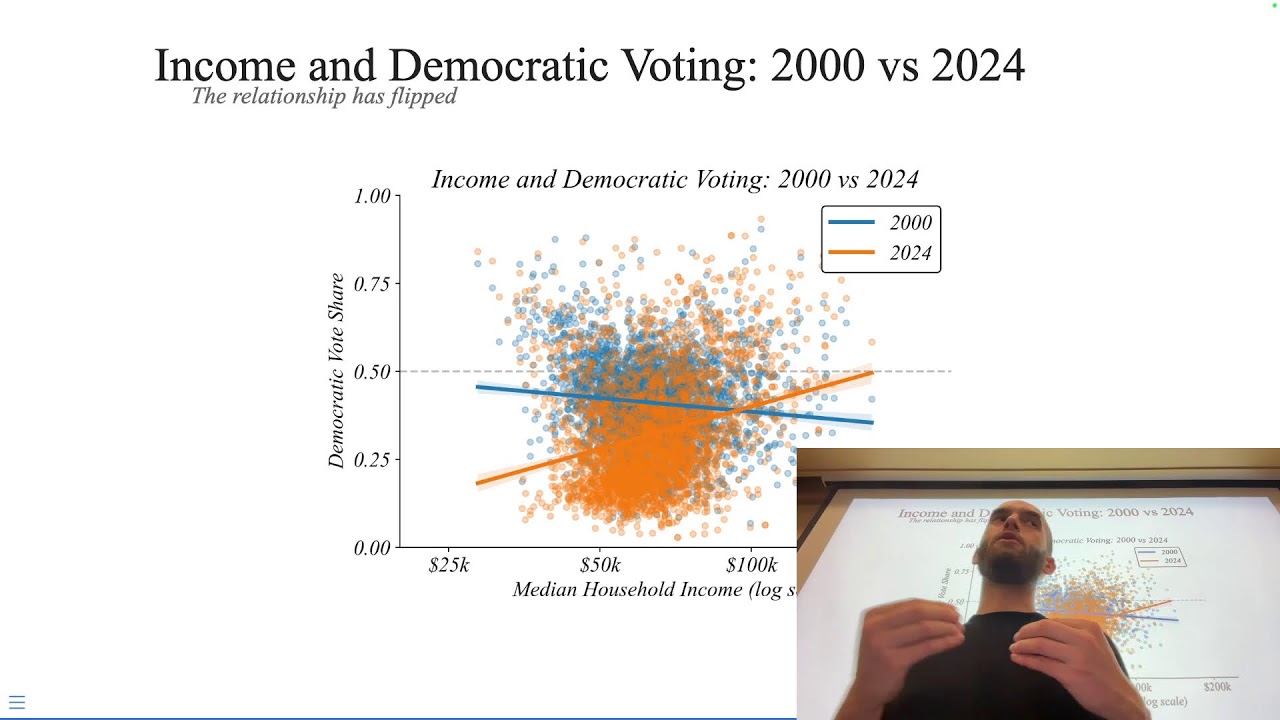
Exercise 2.3 // Conditional Analysis
Use a scatterplot to examine how the relationship between income and voting patterns has changed.
Homework 2.3
Due on Gradescope on Tuesday (instead of Friday!) February 24 at Midnight
MiniExams
MiniExam 2 will be held on Februrary 24 and covers everything in Part 2: numerical relationships, grouped comparisons, and conditional analysis. Practice with the exercises and homework to prepare.