Part 4 | Bivariate GLM
> models with one predictorPart 4 introduces the workhorse of empirical economics: regression analysis. In Part 3, we developed the simplest statistical model of samples with unknown population parameters. This model allowed us to test simple hypotheses about the population parameters. But economic relationships are rarely so simple. The General Linear Model not only lets us test simple hypotheses, but also lets us handle relationships between variables of different types - continuous, categorical, and their interactions - while maintaining our core tools of visualization and residual analysis. These tools are the foundation of modern science.
Part 4.1 | Numerical Predictors
Finding relationships between numerical variables.
Livestream 4.1
Class recording from Fall 2025
Concept 4.1 // Numerical Predictors
The slope parameters follow a normal distribution.
Exercise 4.1 // Numerical Predictors
Relationship between happiness and GDP per capita.
Part 4.2 | Categorical Predictors
Comparing group means using binary indicator variables (two-sample t-test).
Livestream 4.2
Coming soon

Concept 4.2 // Categorical Predictors
Binary predictors turn group comparisons into regression.
Exercise 4.2 // Categorical Predictors
Income and mental health using BRFSS data.
Part 4.3 | Model Diagnostics
Checking whether our model's assumptions hold and what to do when they don't.
Livestream 4.3
Coming soon
Concept 4.3 // Model Assumptions
Residual plots check linearity, homoskedasticity, independence, and normality.
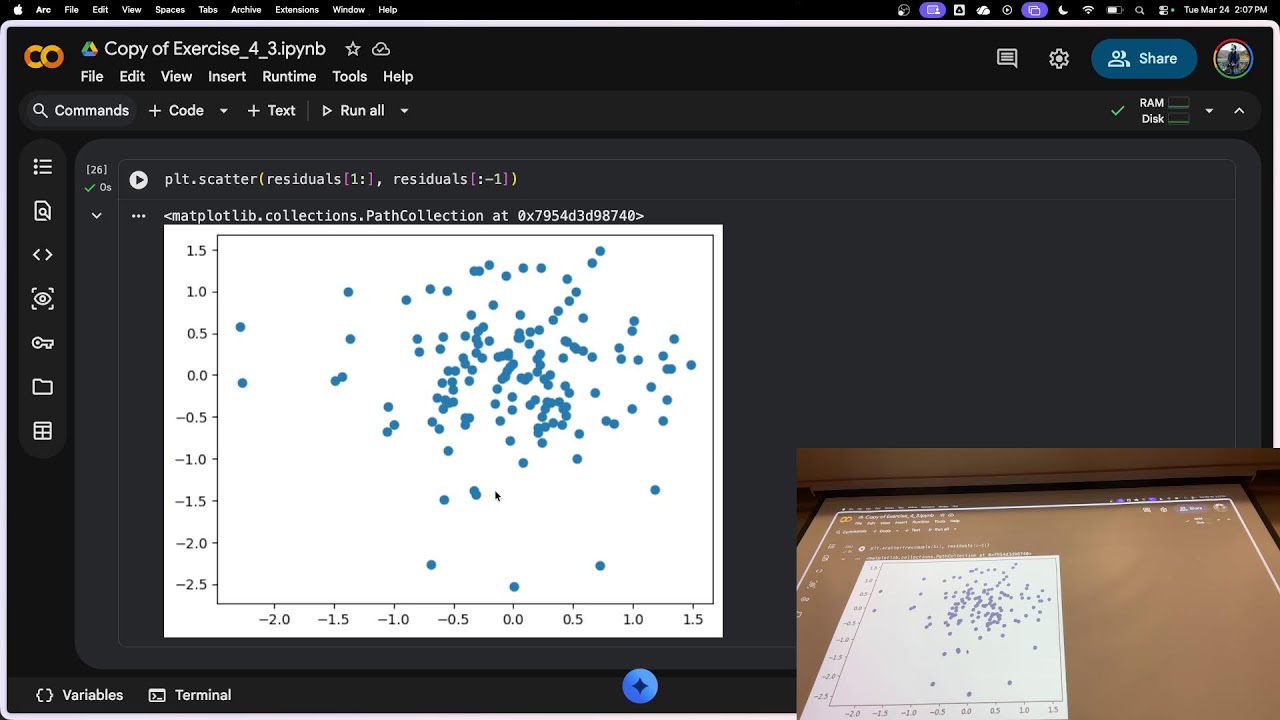
Part 4.4 | The Problem of Timeseries
Autocorrelation violates independence. Differencing and growth rates can mitigate the problem.
Livestream 4.4
Coming soon
Concept 4.4 // The Problem of Timeseries
Levels, first differences, and growth rates for time series data.
MiniExam 4
MiniExam 4 will test your understanding of everything in Part 4: numerical predictors, categorical predictors, model diagnostics, and timeseries.