ECON 0150 | Economic Data Analysis
The economist’s data analysis skillset.
Part 3.2 | Sampling and the Central Limit Theorem
A Big Question
If all we see is the sample, how do we learn about a population?
- In general, a population’s random variables will be unobservable.
- If we only see a sample, what can we say about the population?
Random Variables: Known
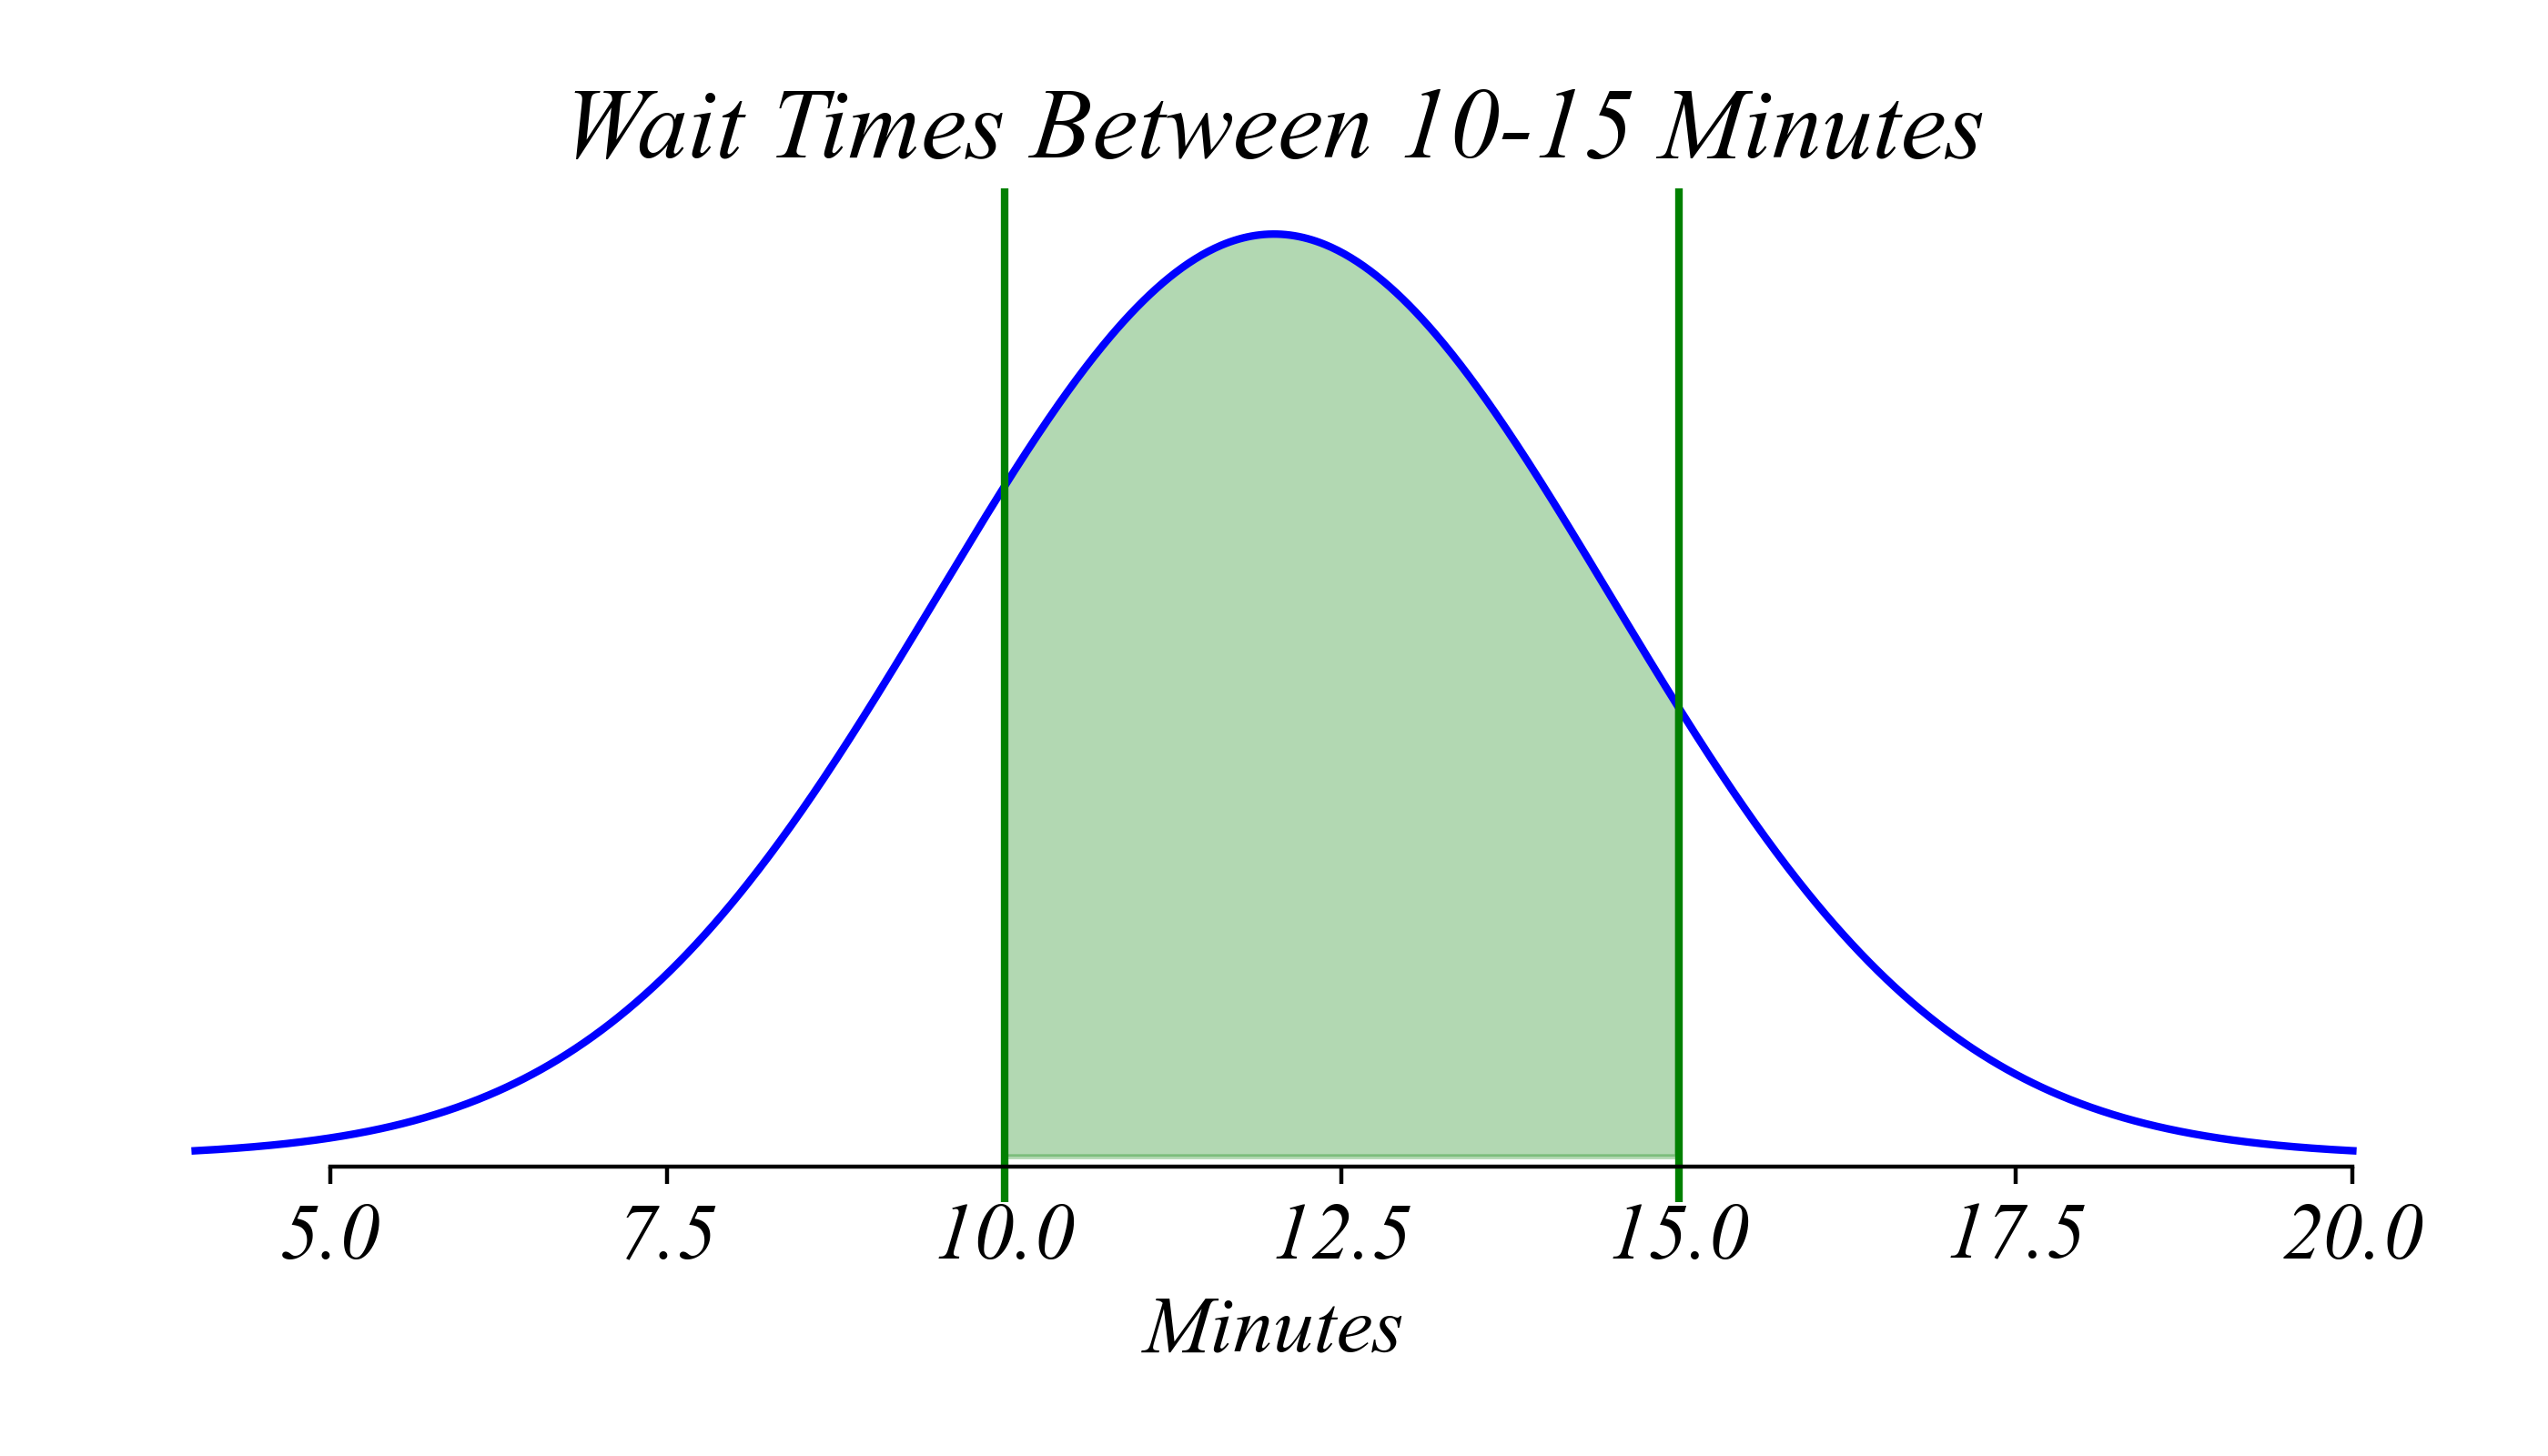
If we know the random variable, we can learn many things about the population.
- Probability wait time < 10:
- P(X < 10) = 0.21
- Probability wait time > 15:
- P(X > 15) = 0.11
- Probability between 10 - 15:
- P(10 < X < 15) = 0.59

> when we know the probability function, we can calculate everything exactly
Random Variables: Known
If we know the random variable, we can learn many things about the population.

> but what can we know about the population if we only see the sample?
Random Variables: Unknown
But if all we see is the sample, what can we know about a population?

> how do we learn about \(\mu\) if all we have is \(n\), \(\bar{x}\), and \(S\)?
Exercise 3.2 | Sampling Dice (sample size: n=1)
Lets pretend we don’t know the probability function for dice.
Lets start with something boring.
- Roll a dice once (sample size: n=1).
- We’ll plot the distribution of our samples.
Exercise 3.2 | Sampling Variability
Your samples have a lot of variability!

> this variability perfectly matches what we would expect from a fair dice
Exercise 3.2 | Sampling Dice (n=2)
Lets pretend we don’t know the probability function for dice.
Next is something slighly less boring.
- Roll a dice once (sample size: n=2).
- We’ll plot the distribution of our samples.
Exercise 3.2 | Sampling Variability
Like before, each sample has a slighly different sample mean.

> theres a lot of variability in your sample means!
> what do you expect to see when we plot these sample means (\(\bar{x}\))?
Exercise 3.2 | Sampling Variability
The variability in the sample mean with a larger sample size.

> our sample means are more bunched (like a pyramid) in the middle! why?
> there are more ways to get 7/2 than 2/2!
Exercise 3.2 | Sampling Dice (n=3)
Lets pretend we don’t know the probability function for dice.
Next is something even less boring.
- Roll a dice once (sample size: n=3).
- We’ll plot the distribution of our samples.
Exercise 3.2 | Sampling Variability
The variability in the sample mean with a larger sample size.

> theres a even more variability in your sample means!
> what do you expect to see when we plot these sample means (\(\bar{x}\))?
Exercise 3.2 | Sampling Variability
The variability in the sample mean with a larger sample size.

> what do you notice with the shape with n=3?
Exercise 3.2 | Sampling Variability
The variability in the sample mean with a larger sample size.

> what do you notice with the shape with n=3?
Exercise 3.2 | Sampling Variability
The variability in the sample mean with a larger sample size.

> there’s some curvature to the shape
Exercise 3.2 | Sampling Dice (n=30)
Lets pretend we don’t know the probability function for dice.
Next is something very un-boring.
- Roll a dice once (sample size: n=30).
- We’ll plot the distribution of our samples.
Exercise 3.2 | Sampling Variability
The variability in the sample mean with a larger sample size.

> theres a even more ways your sample could look!
> what do you expect to see when we plot these sample means (\(\bar{x}\))?
Exercise 3.2 | Sampling Variability
What happens when we really increase the sample size?

> what do you notice with the shape with n=30?
Exercise 3.2 | Sampling Variability
What happens when we really increase the sample size?

> the distribution of sample means gets tighter and more bell-shaped
Exercise 3.2 | Sampling Variability
What happens when we really increase the sample size?

> what is this probability function in red?
Random Variables: Known
If we know the random variable, we can learn many things about the population.
- Probability wait time < 10:
- P(X < 10) = 0.21
- Probability wait time > 15:
- P(X > 15) = 0.11
- Probability between 10 - 15:
- P(10 < X < 15) = 0.59

> when we know the probability function, we can calculate everything exactly
Random Variables: Unknown
If we take multiple samples, we get different sample means.
Each sample gives us a different estimate of the population mean.
Random Variables: Unknown
If we take multiple samples, their means will vary.

Random Variables: Unknown
If we take multiple samples, their means will vary, and by much less than the original distribution.

> why? think about rolling two dice… it’s much less likely to get a 2 than a 7
Random Variables: Unknown
As sample size grows, the distribution of the sample means approaches a normal distribution.

Random Variables: Unknown
As sample size grows, the normal distribution the sample means approach gets narrower.

Random Variables: Unknown
The normal distribution the sample means approach is centered on the population mean!

> the sample mean \(\bar{x}\) follows a normal distribution around the truth 😱
\[\bar{x} \sim N\Big(\mu, \frac{\sigma}{\sqrt{n}}\Big)\]
Random Variables: Unknown
This works for (nearly) any distribution shape as sample size increases.

The Central Limit Theorem
The distribution of sample means approximates a normal distribution as sample size increases, regardless of the population’s distribution.
Key insights:
- Sample means cluster around μ
- Standard error = σ/√n
- Normal shape emerges
Implications:
- We can predict the behavior of x̄
- This works for (nearly) ANY distribution
