ECON 0150 | Economic Data Analysis
Part 3.1 | Data vs the Population
Inferences From Data
- We’ve summarized data
- But often we want to say something about the population, not just our data
Data Question 1: Sleep Time in Two Samples
![]()
> everyone in Group A sleeps longer than anyone in Group B
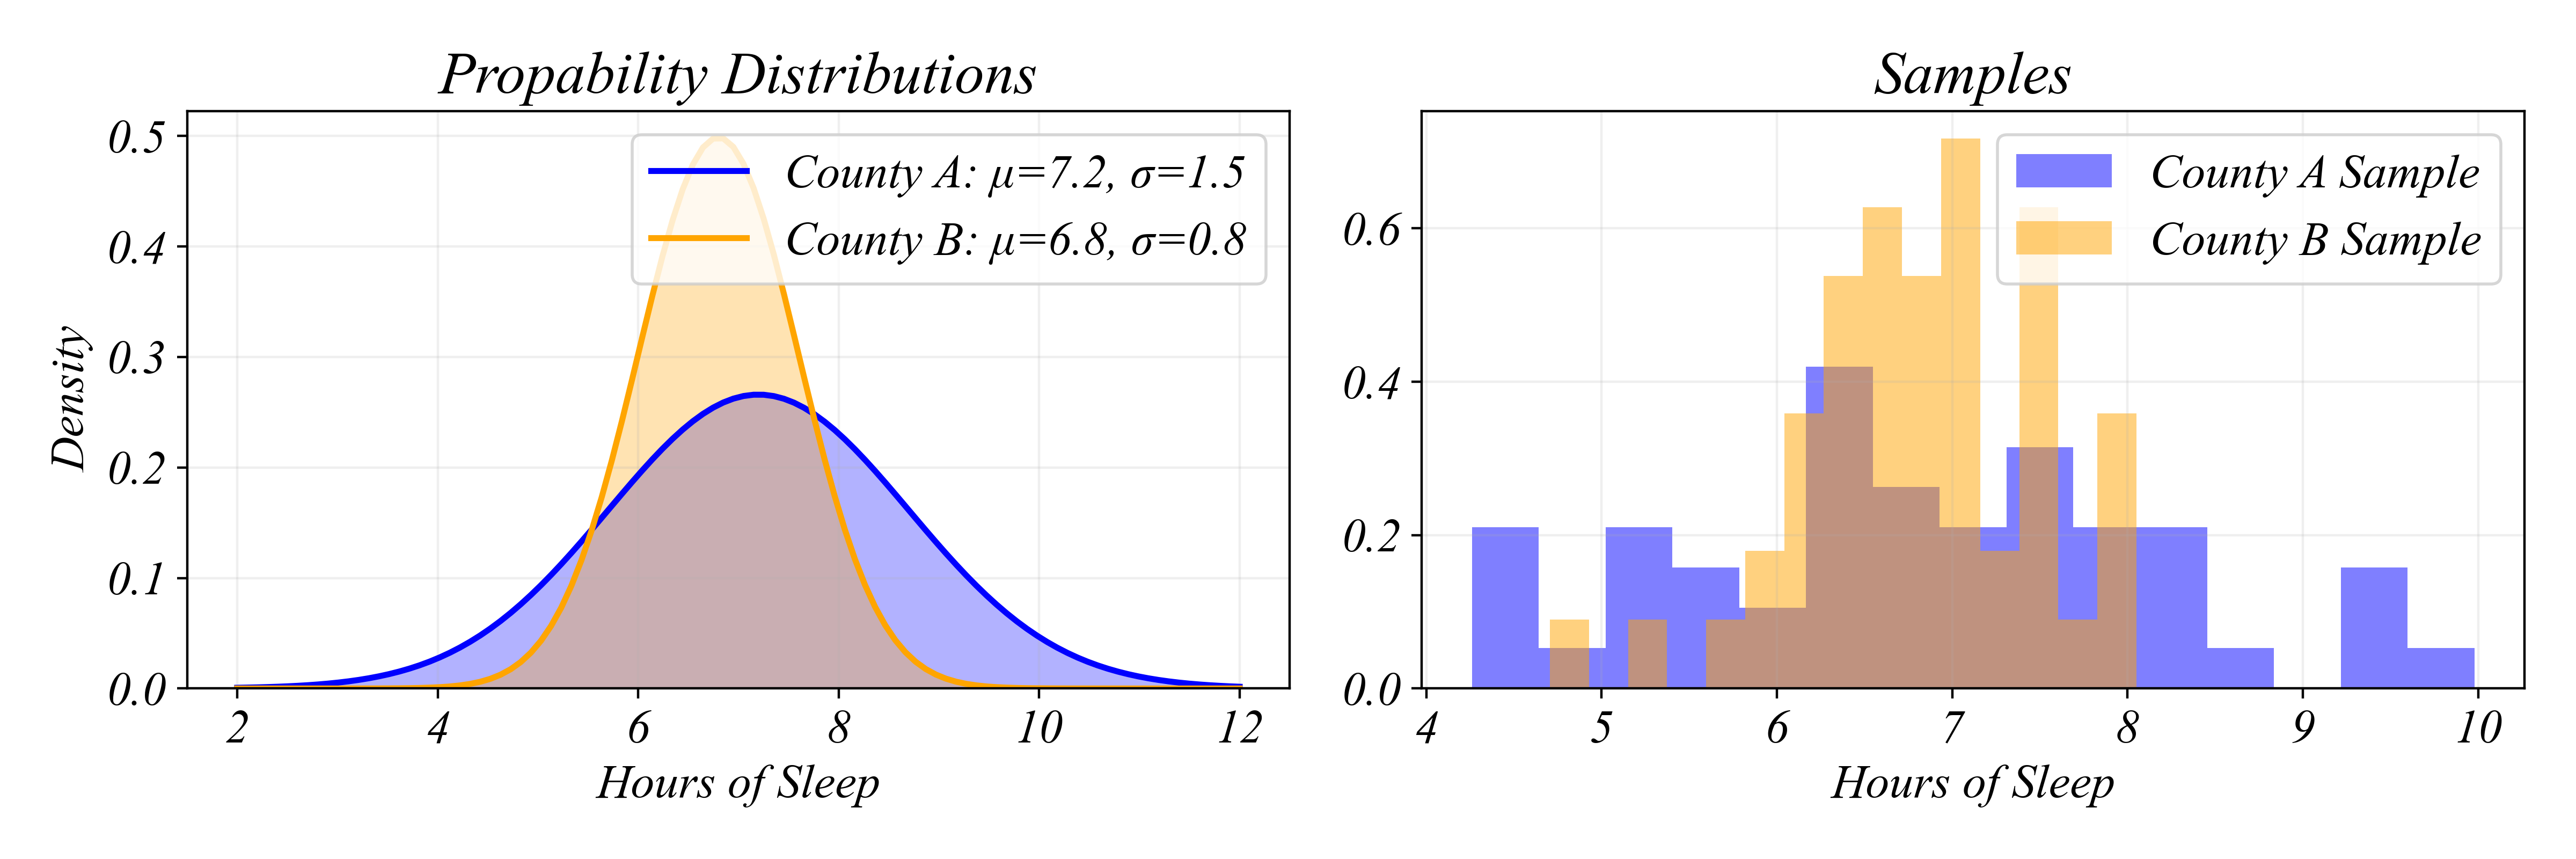
Data Question 2: Sleep Time in Two Samples
![]()
> these distributions overlap… lets compare them more precisely
Measures of Location
Sample (Data) Mean: The average value \[\bar{x} = \frac{x_1 + x_2 + ... x_N}{N}\]
Measures of Location
Sample (Data) Mean: The average value \[\bar{x} = \frac{1}{n}\sum_{i=1}^{n} x_i\]
# Calculate means
mean_A = group_A.mean()
mean_B = group_B.mean()
Group A mean: 7.20 hours
Group B mean: 6.72 hours
Data Question 2: Sleep Time in Two Samples
![]()
Sample Group A mean: 7.20 hours
Sample Group B mean: 6.72 hours
> Group A sleeps longer on average in our sample
> but some in Sample Group B sleep longer than most in Sample Group A!
Measures of Dispersion
Range: difference between the largest and smallest value in the data
- Simple but doesn’t respond to changes near the middle of the distribution
Measures of Dispersion
Mean Deviation: difference between each value and the average
\[ \sum \frac{x_i - \bar{x}}{n}\]
- Simple but the average of the difference is zero…
Measures of Dispersion
Mean Absolute Deviation: absolute value of the difference from the average
\[ \sum \frac{|x_i - \bar{x}|}{n}\]
- The mean isn’t zero
- A little more complex and isn’t so nice mathematically
Measures of Dispersion
Variance: average squared difference from the mean
\[ Var_X = \sum \frac{(x_i - \bar{x})^2}{n}\]
- Treats negatives appropriately
- The mean isn’t zero
- Mathematically nice
- Units are uninformative
Measures of Dispersion
Standard Deviation: A measure of spread \[\begin{align}S_X = \sqrt{\sum \frac{(x_i - \bar{x})^2}{n}}\end{align}\]
- Treats negatives appropriately
- The mean isn’t zero
- Mathematically nice
- Units are roughly average deviation from the mean
Measures of Dispersion
Standard Deviation: A measure of spread \[S_X = \sqrt{\sum \frac{(x_i - \bar{x})^2}{n}}\]
# Calculate standard deviations
std_A = group_A.std()
std_B = group_B.std()
Group A std dev: 1.60 hours
Group B std dev: 0.70 hours
> Group A has more variability - some sleep much less, some much more
Sample vs Population
![]()
Old question: “Which sample group sleeps longer?” (about the data)
New question: “Which county sleeps longer?” (about the population)
Sample vs Population
![]()
\(\mu\) - population mean
\(\sigma\) - population standard deviation
Sample vs Population
- Data: 50 individuals we happened to sample from both counties
- Population: All people who could live in these counties
- Even if we surveyed everyone today, tomorrow would bring new residents
- The population is a theoretical concept - an infinite pool of possibilities
Fundamental Tension: we observe data, which is drawn from a population, but is not the population itself, which is the object of our study.
Sample vs Population
Random Variable: a random process about a population
- the random variable is like a deck of cards
Probability (Mass/Density) Function: a function that assigns probabilities to each possible outcome
- the probability function is like which cards are in the deck
Observation: a realization of a random variable . . .
- the observation is the card you drew
Sample: a collection of observations
- the sample is the record of cards you’ve drawn
Data is a Sample
Random Variable: a random process about a population
Probability Function: a function that assigns probabilities to each possibility
> data is a sample drawn from a random variable
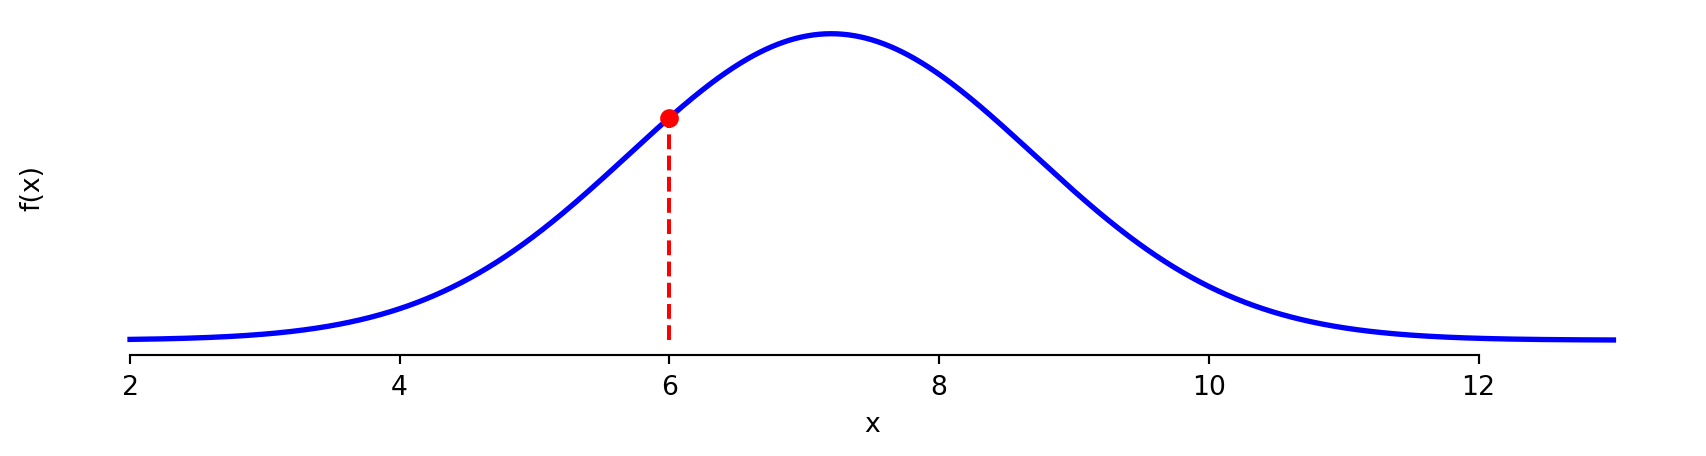
Probability Functions
![]()
Probability Density Function (PDF)
- \(f(x) \geq 0\): probabilities are never negative.
- \(\int f(x)\,dx = 1\): total probability sums to one.
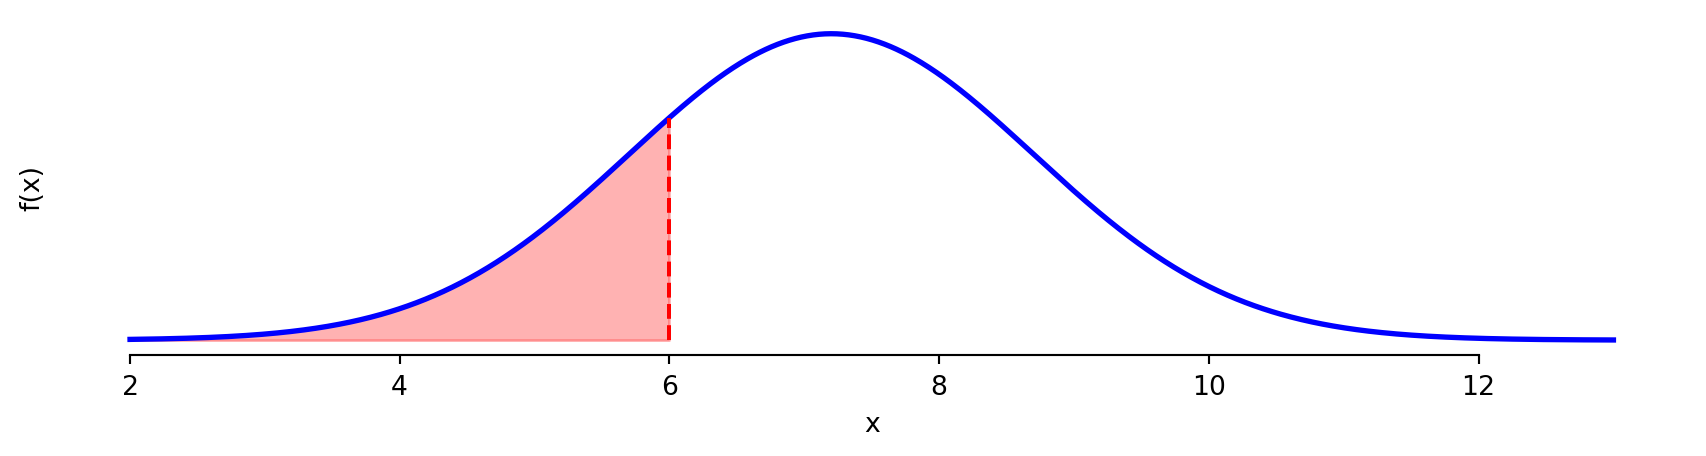
Cumulative Distribution Function (CDF)
- \(F(x)\) is non-decreasing: more area accumulates as \(x\) increases.
- \(F(-\infty) = 0\), \(F(\infty) = 1\): ranges from 0 to 1.
- \(F(x)\) gives probability directly: \(P(X \leq 5) = F(5)\).
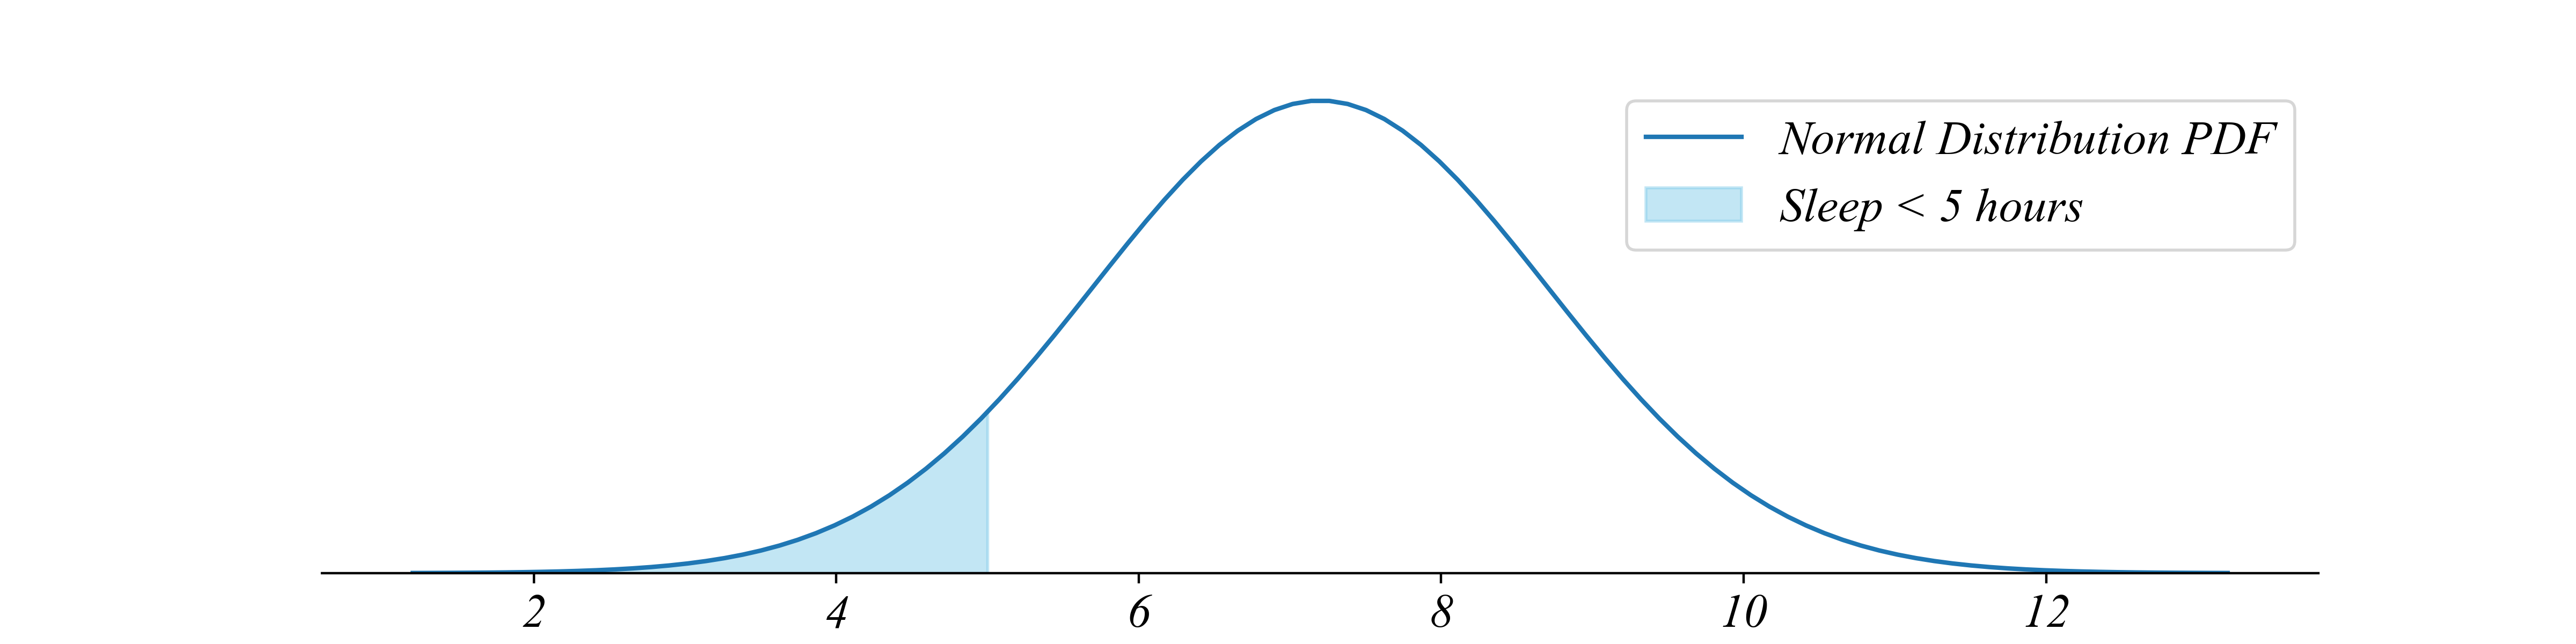
Exercise 3.1 | Known Distribution
County A’s probability function:
\[x_i \sim N(μ=7.2, σ=1.5)\]
- What proportion of the population sleeps less than 5 hours?
stats.norm.cdf(5, loc=mu, scale=sigma).item()
Exercise 3.1 | Known Distribution
County A’s probability function:
\[x_i \sim N(μ=7.2, σ=1.5)\]
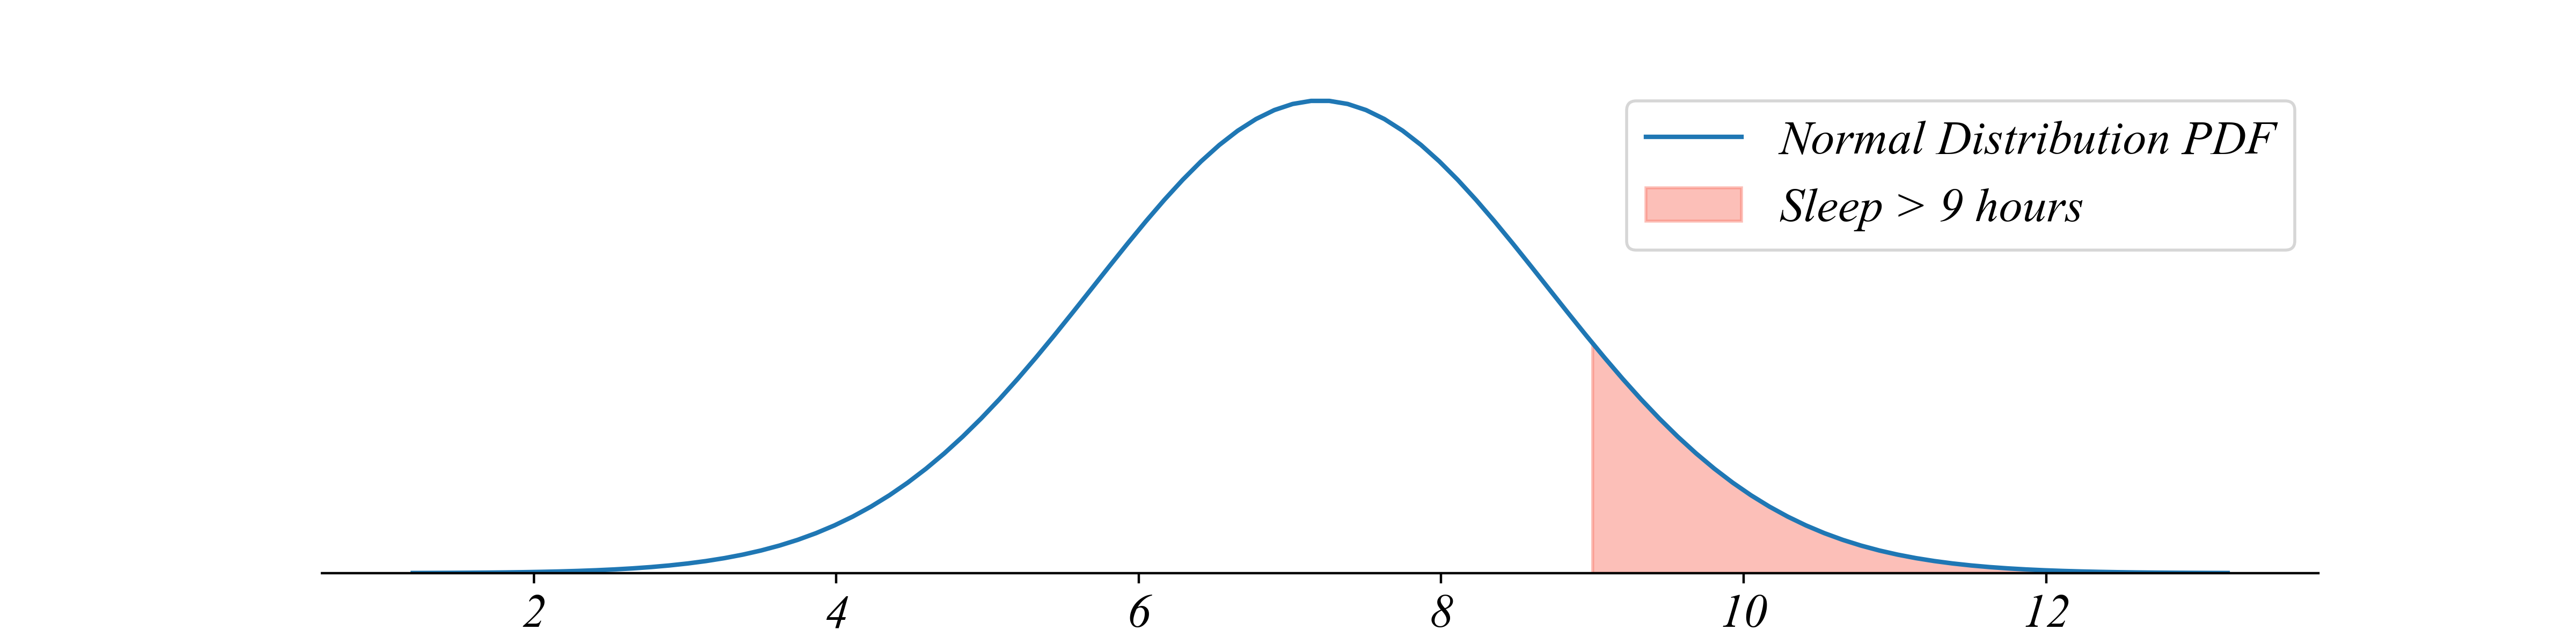
- What proportion of the population sleeps more than 9 hours?
1 - stats.norm.cdf(9, loc=mu, scale=sigma).item()
Exercise 3.1 | Known Distribution
County A’s probability function:
\[x_i \sim N(μ=7.2, σ=1.5)\]
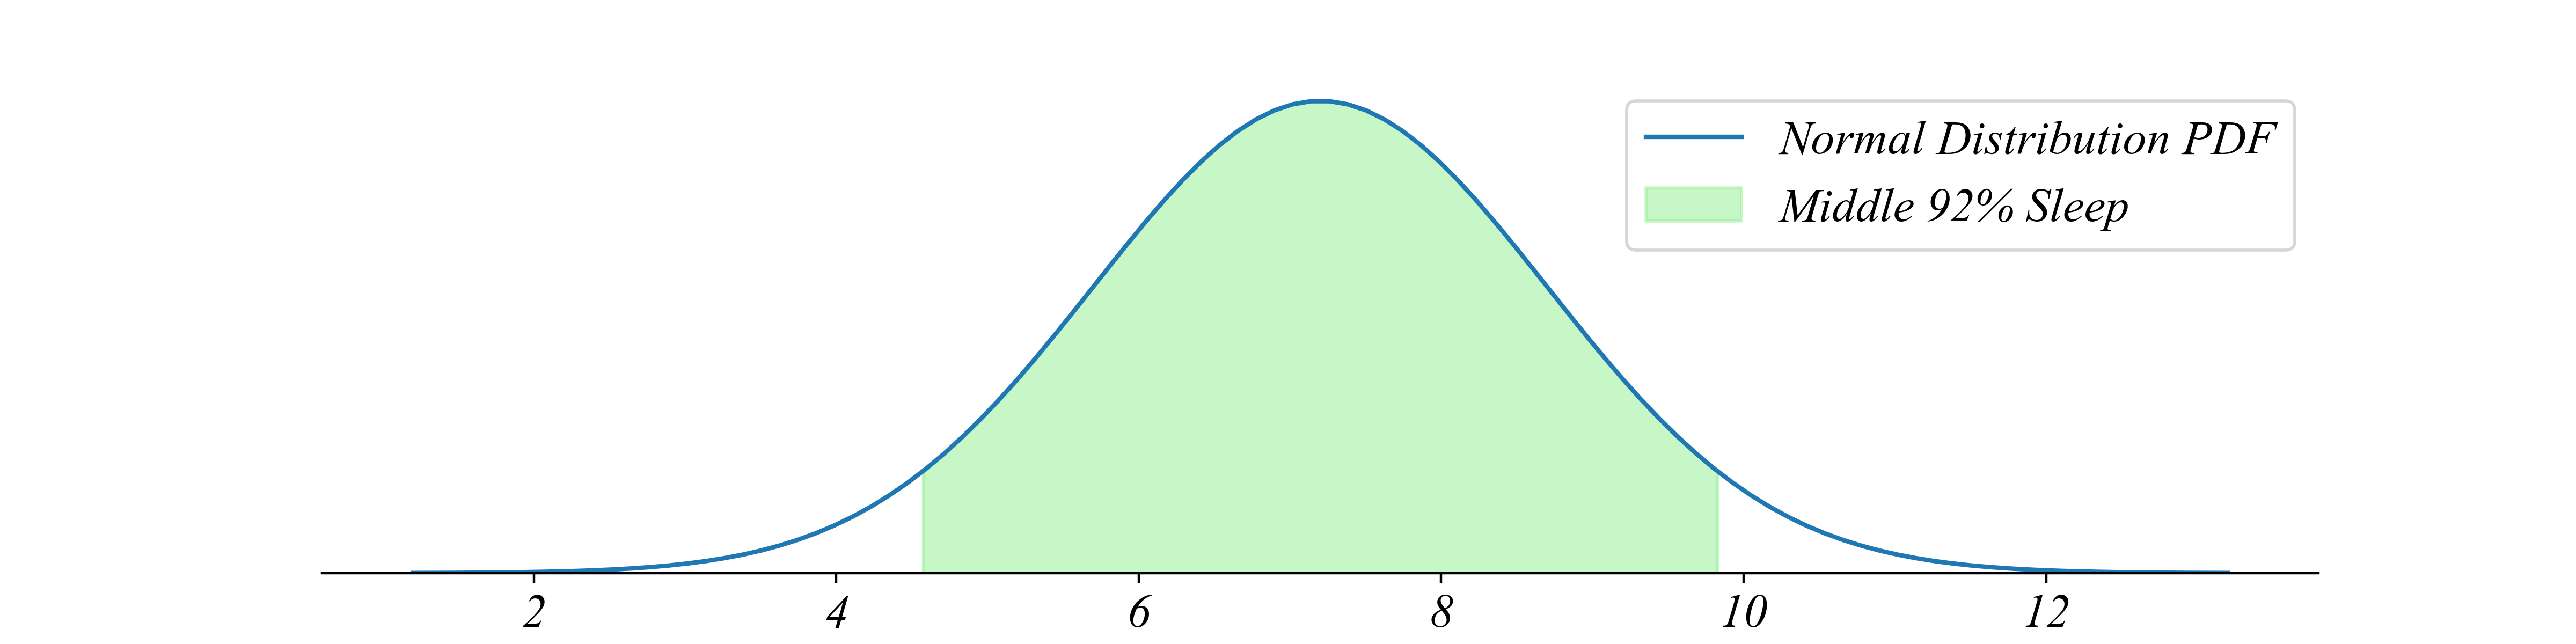
- How much sleep does the middle 92% of the population get?
lower_bound = stats.norm.ppf(0.04, loc=mu, scale=sigma)
upper_bound = stats.norm.ppf(0.96, loc=mu, scale=sigma)
Unknown Distributions
What we observe:
- Sample size: \(n = 50\)
- Sample mean: \(\bar{x} = 7.24\) hours
- Sample standard deviation: \(s = 1.48\) hours
What we want to know:
- Population mean: \(\mu = ?\)
- Population standard deviation: \(\sigma = ?\)
- Population distribution: \(f(x) = ?\)
Unknown Distributions
The sample statistics (\(\bar{x}, S\)) are not the population parameters (\(\mu, \sigma\)).
\[\bar{x} \neq \mu\] \[s \neq \sigma\]
The Central Question
- Part 3.2 | Central Limit Theorem - the distribution of the sample mean
- Part 3.3 | Confidence Intervals - the closeness of the sample mean to the truth
- Part 3.4 | Statiscial Modeling - testing wrongness of hypothetical relationships
> we can answer questions about an unknown population using just a sample