| Event | Revenue | Offer ID | |
|---|---|---|---|
| 0 | transaction | 34.56 | 2off10 |
| 1 | transaction | 18.97 | 2off10 |
| 2 | transaction | 33.90 | Bogo 5 |
| 3 | transaction | 18.01 | Bogo 10 |
| 4 | transaction | 19.11 | Bogo 10 |
Grouping and Counting
How frequent is each offer-type?
Lets start by counting each offer-type in the categorical variable Offer ID.

> so Bogo 5 and 2off10 appear most frequently
> but how much revenue does each offer-type bring in?
Grouping and Summing
What is the total revenue for each offer-type?
Lets find total revenue by Offer ID.

> ‘Informative’ brings in no revenue (makes sense)
> Bogo 5, 3off7, and 2off10 bring in the most revenue
Grouping and Summing
What is the total revenue for each offer-type?
Lets find total revenue by Offer ID.
how many rows would you expect if we group by Event?
Grouping and Counting
How frequent is each offer-type?
Lets group on Event to count event-types.

> it looks like ‘offer’ may not actually be a transaction… lets investigate
Grouping and Summing
What is the total revenue for each event-type?
Lets group on Event and find the total revenue by event-type.

> just as we suspected, “offer” events brings in 0 revenue
> so Event tells us whether the row is an ‘offer’ or a ‘transaction’
Grouping and Summing
What is the total revenue for each event-type?
Lets group on Event and find the total revenue by event-type.
> so how many times was each offer-type actually sent?
Filtering, Grouping, and Counting
How many times was each offer-type sent?
Lets filter Event for just ‘offer’ then group on Offer ID and count.

> so Bogo 5, Bogo 10, and 2off10 were sent most frequently
> how much did each offer-type bring in on average?
Grouping and Averaging
What is the average transaction amount per offer type?
Lets find the average (mean) revenue we can expect after sending each offer-type.
> this tells us how much Starbucks expects to bring in after sending each offer type
Grouping and Averaging
What is the average transaction amount per offer type?
Lets find the average (mean) revenue we can expect after sending each offer-type.
> but how can ‘2off20’ have an average below 20?
> this includes offers that were not accepted!
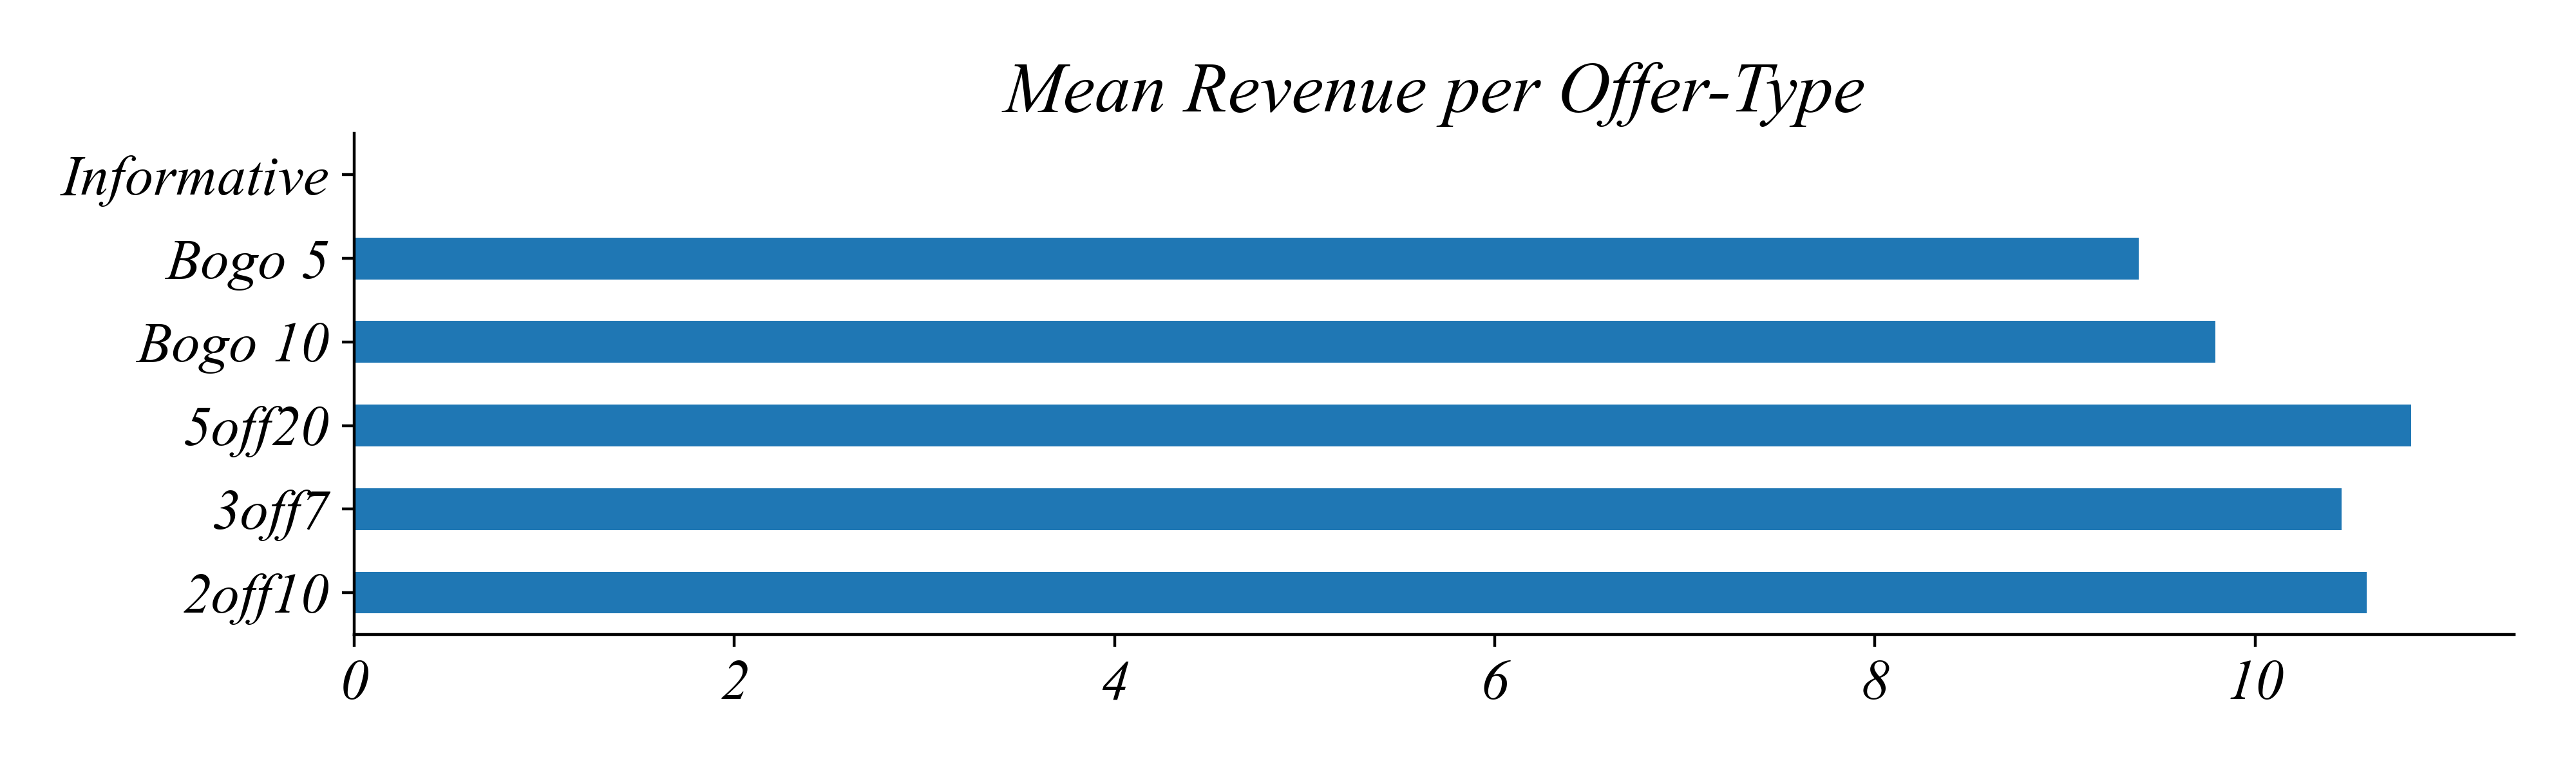
Filtering, Grouping, and Averaging
What’s the average revenue per offer-type?
Lets filter Event for just ‘transaction’ then group on Offer ID and find the average (mean) transaction amount.

> does this mean ‘2off20’ changes behavior the most?
> not necessarliy!
Filtering, Grouping, and Averaging
What’s the average revenue per offer-type?
Lets filter Event for just ‘transaction’ then group on Offer ID and find the average (mean) transaction amount.
> this doesn’t tell us how often people actually used the offers
Filtering, Grouping, and Counting
How many times was each offer-type used?
Lets filter Event for just ‘transaction’ then group on Offer ID and count.

> so Bogo 5 and 2off10 were used most frequently
Filtering, Grouping, and Counting
How many times was each offer-type used?
Lets filter Event for just ‘transaction’ then group on Offer ID and count.
> does this mean they were the most effective?
> no! we want to find how likely an offer will turn into a transaction when sent
Filtering, Grouping, and Transforming
How likely is each offer-type to be used?
Lets divide the number of transactions by the number of offers sent by offer-type.
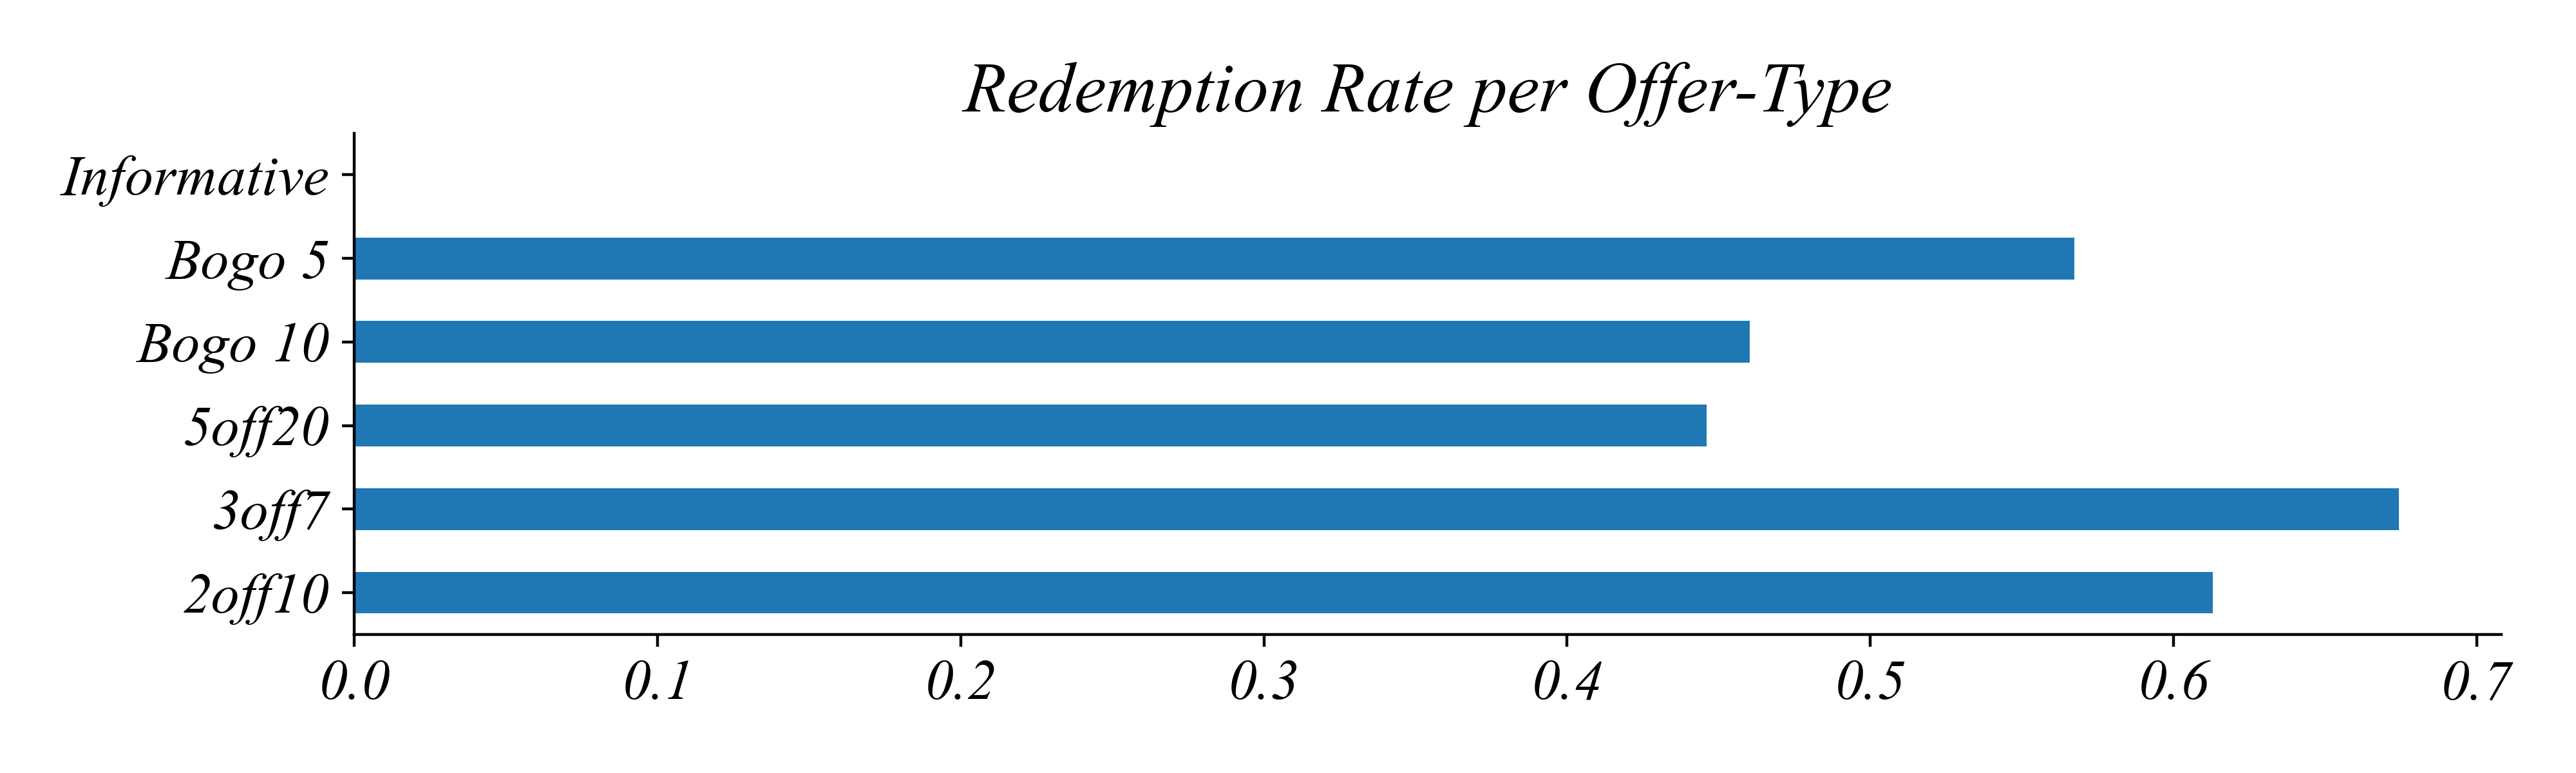
> Bogo 5, 3off7, and 2off10 have the highest use rate!
Filtering, Grouping, and Transforming
How likely is each offer-type to be used?
Lets divide the number of transactions by the number of offers sent by offer-type.
> this is a pretty reasonable way to measure ‘effectiveness’
> but lets also consider how much spending behavior changes too
Starbucks Offers: Effectiveness
Which offers are truly most effective?