Part 1.0 | Variable Types
We cannot typically understand our data without summarizing it.

The main differentiators between a good and bad summarization tools is the dimension of the data and what you’re trying to understand about the data.
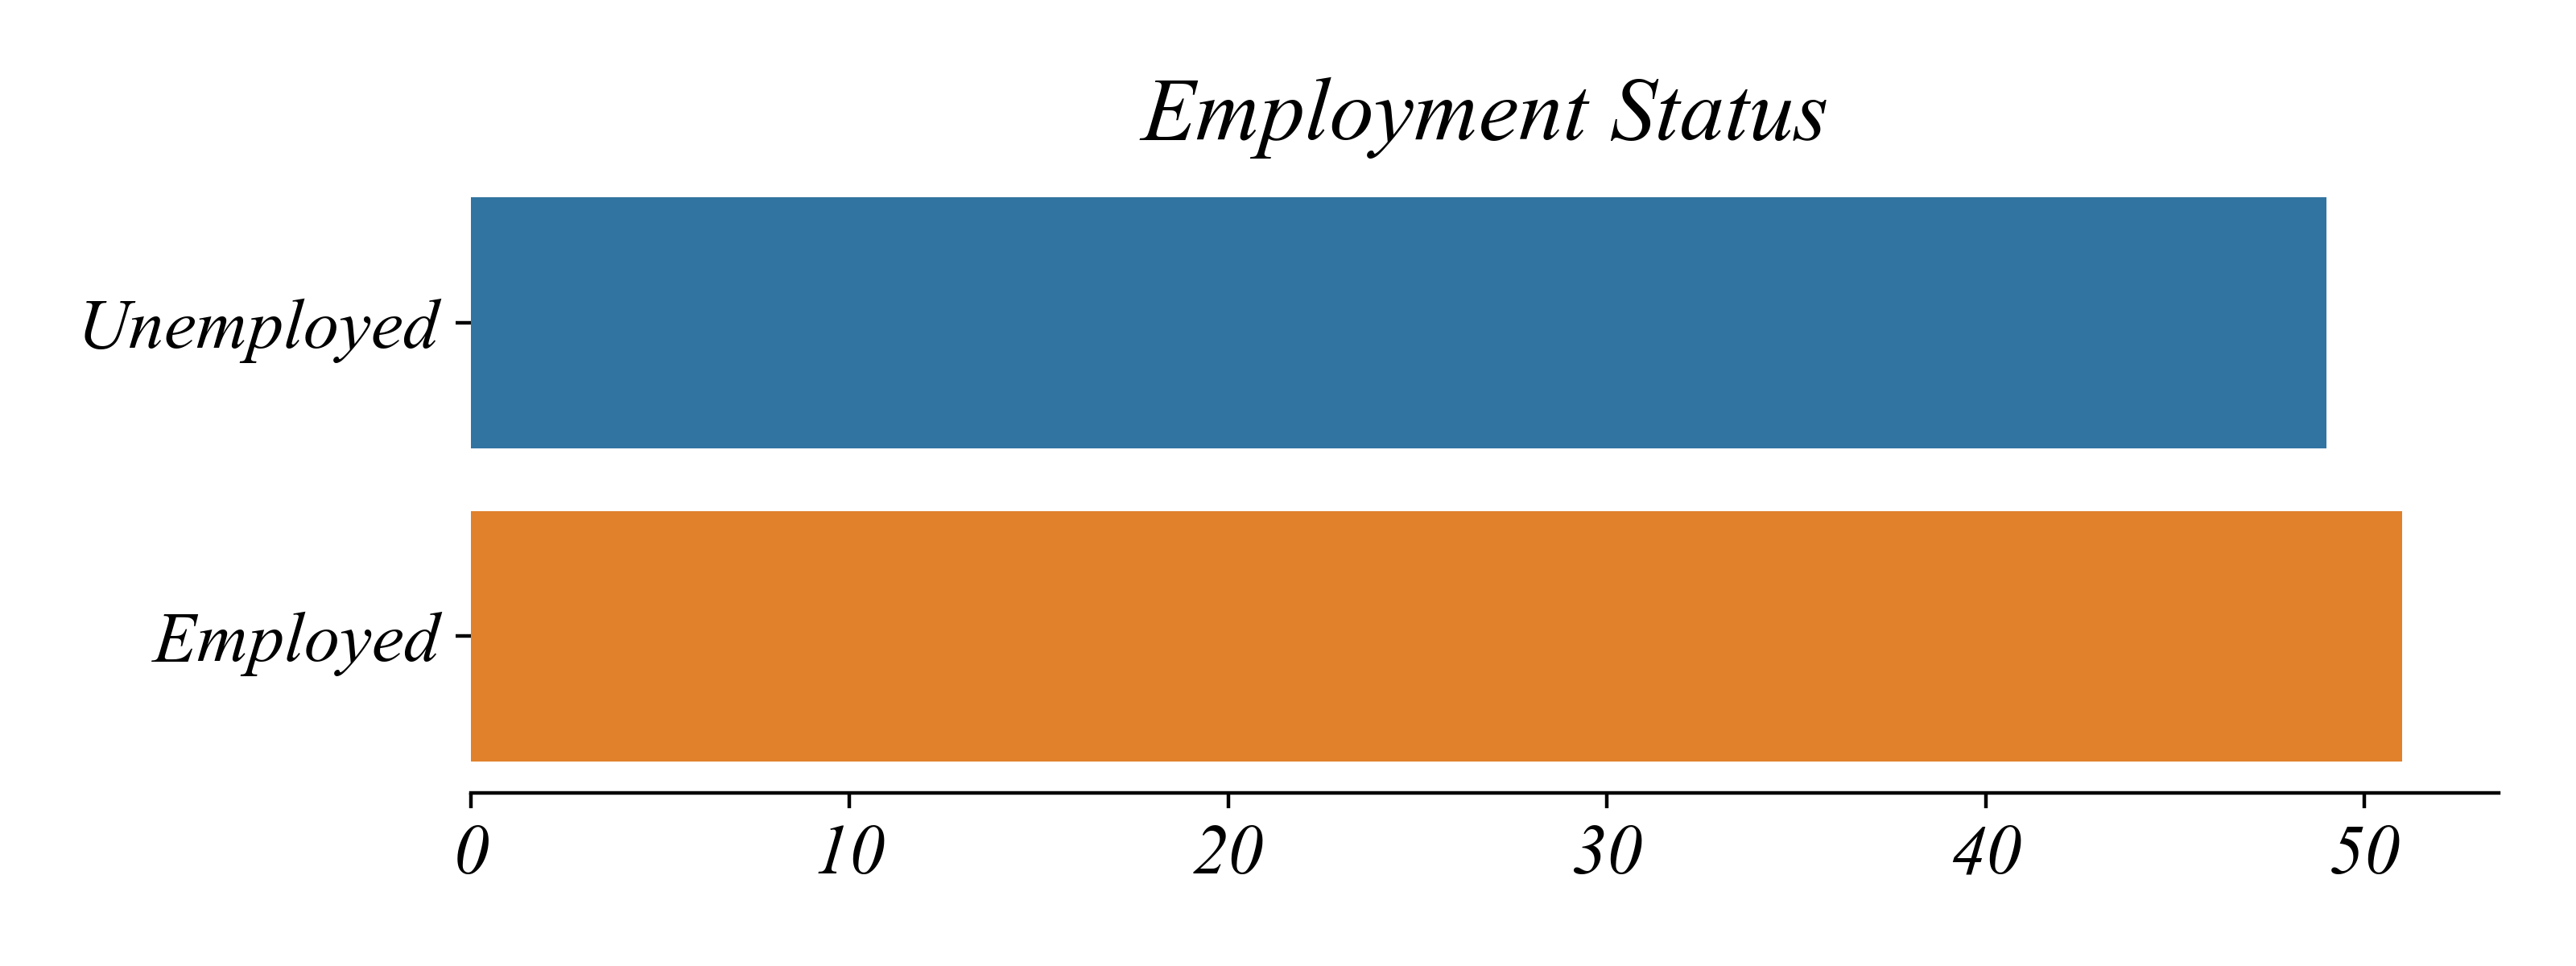
Exercise: Employment Status
What type of variables are contained in employment_status.csv?
Binary Categorical: two categories (Employed, Unemployed)
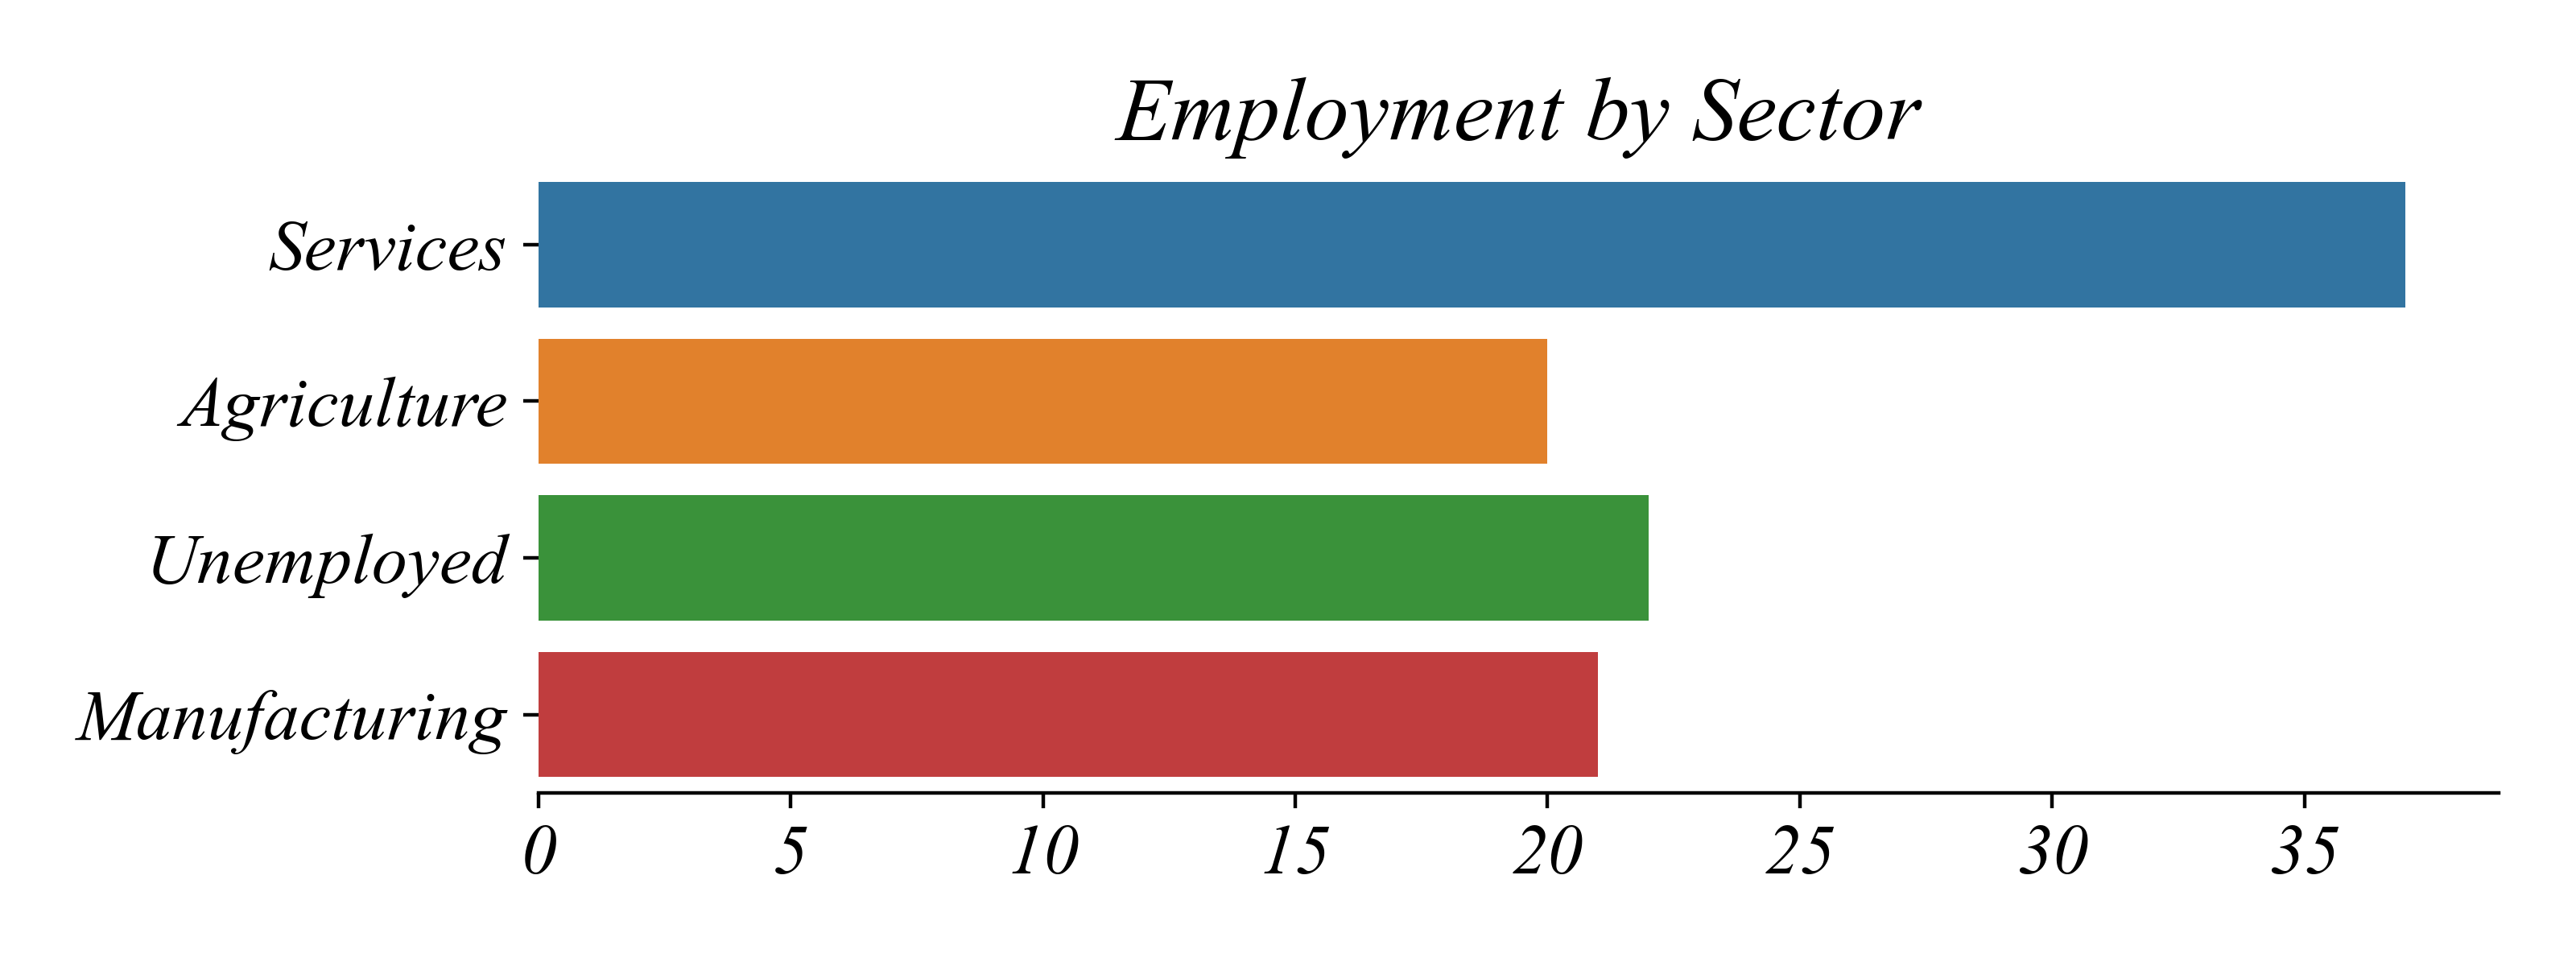
Exercise: Employment Sector
What type of variables are contained in employment_sector.csv?
Nominal: no inherent order (Agriculture, Services, Unemployed)
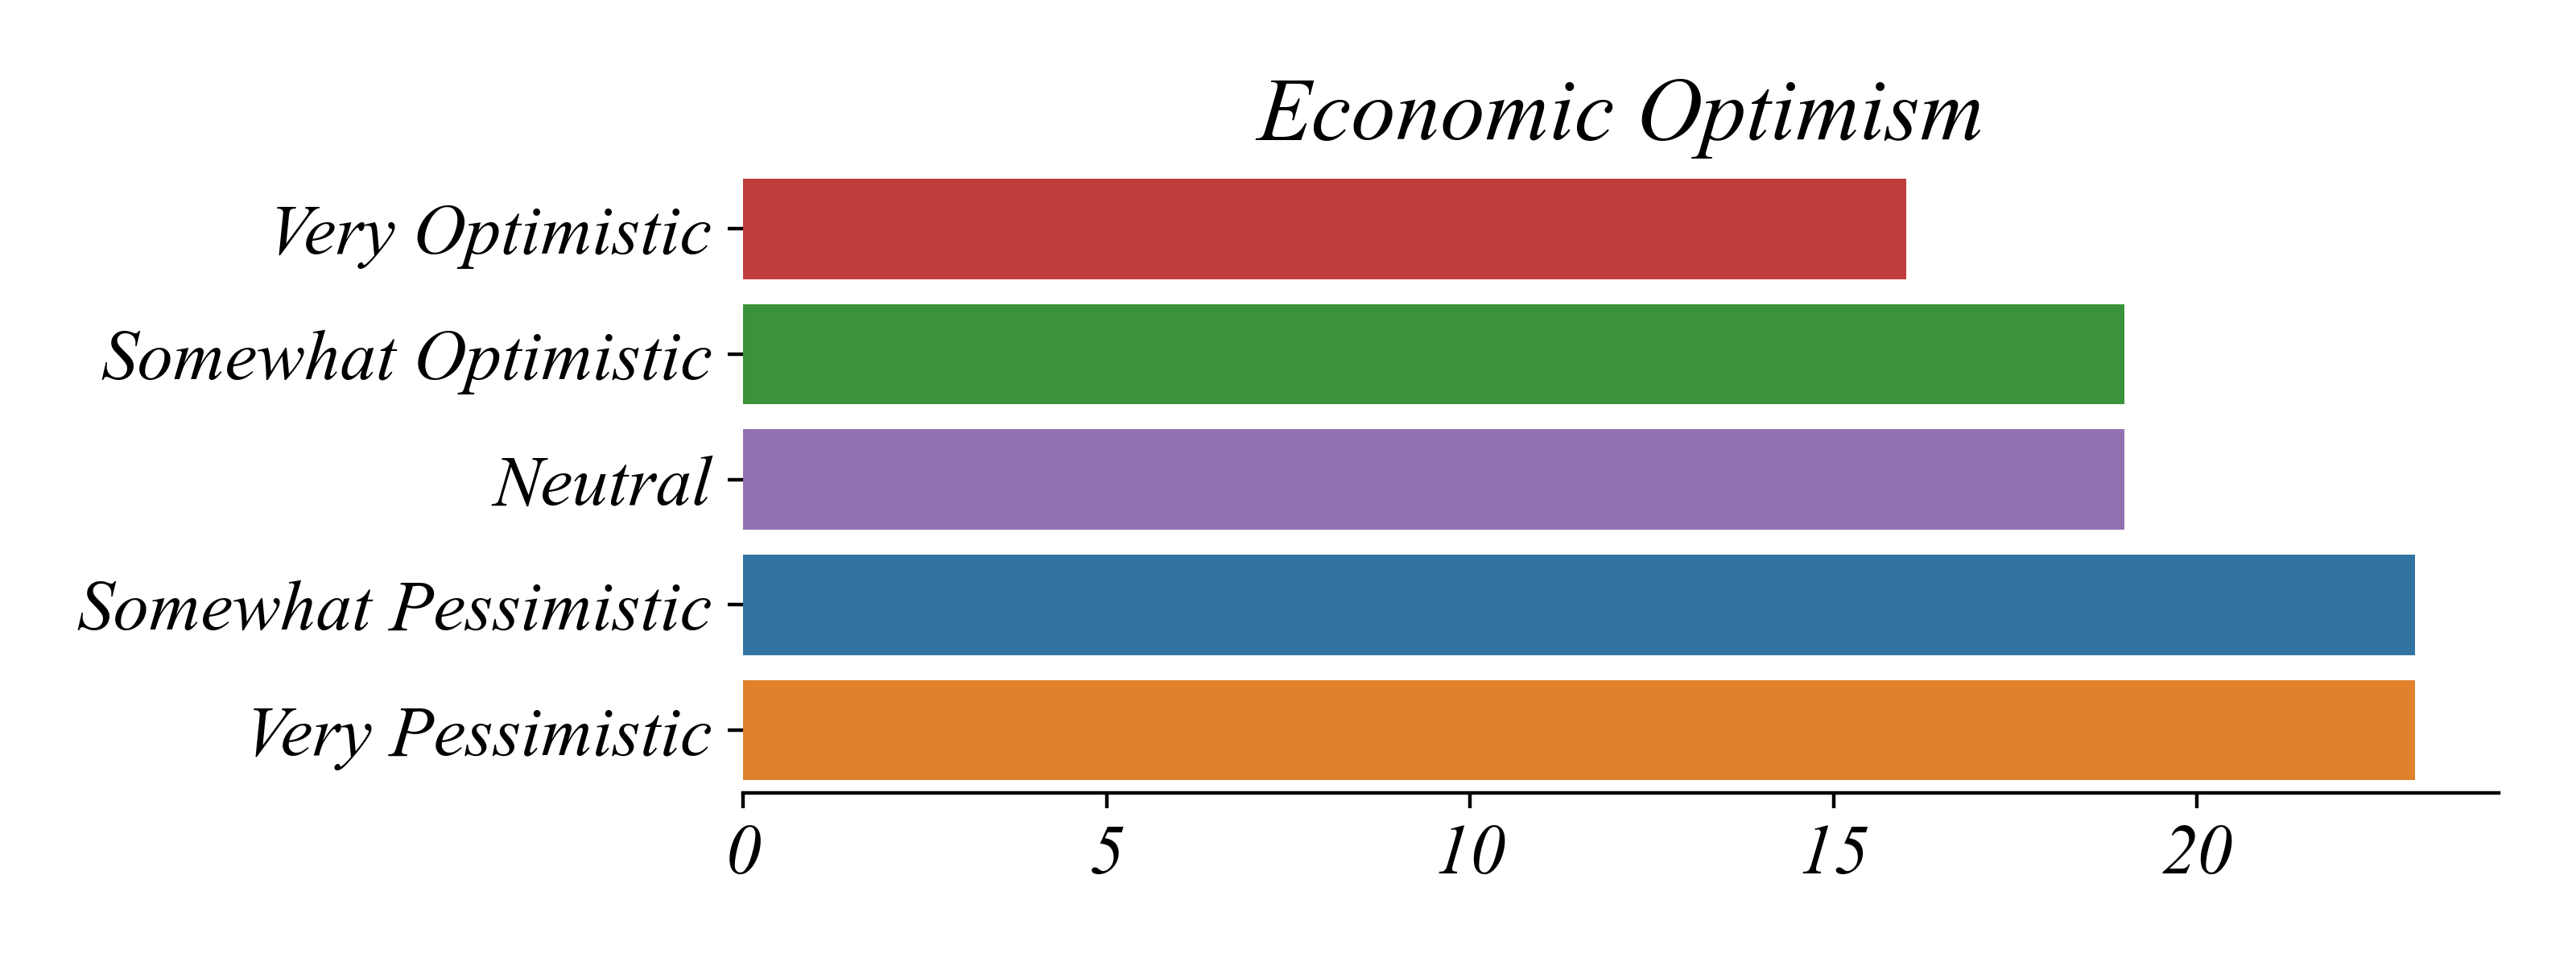
Exercise: Economic Optimism
What type of variables are contained in economic_optimism.csv?
Ordinal: meaningful order without meaningful intervals (Very Pessimistic to Very Optimistic)
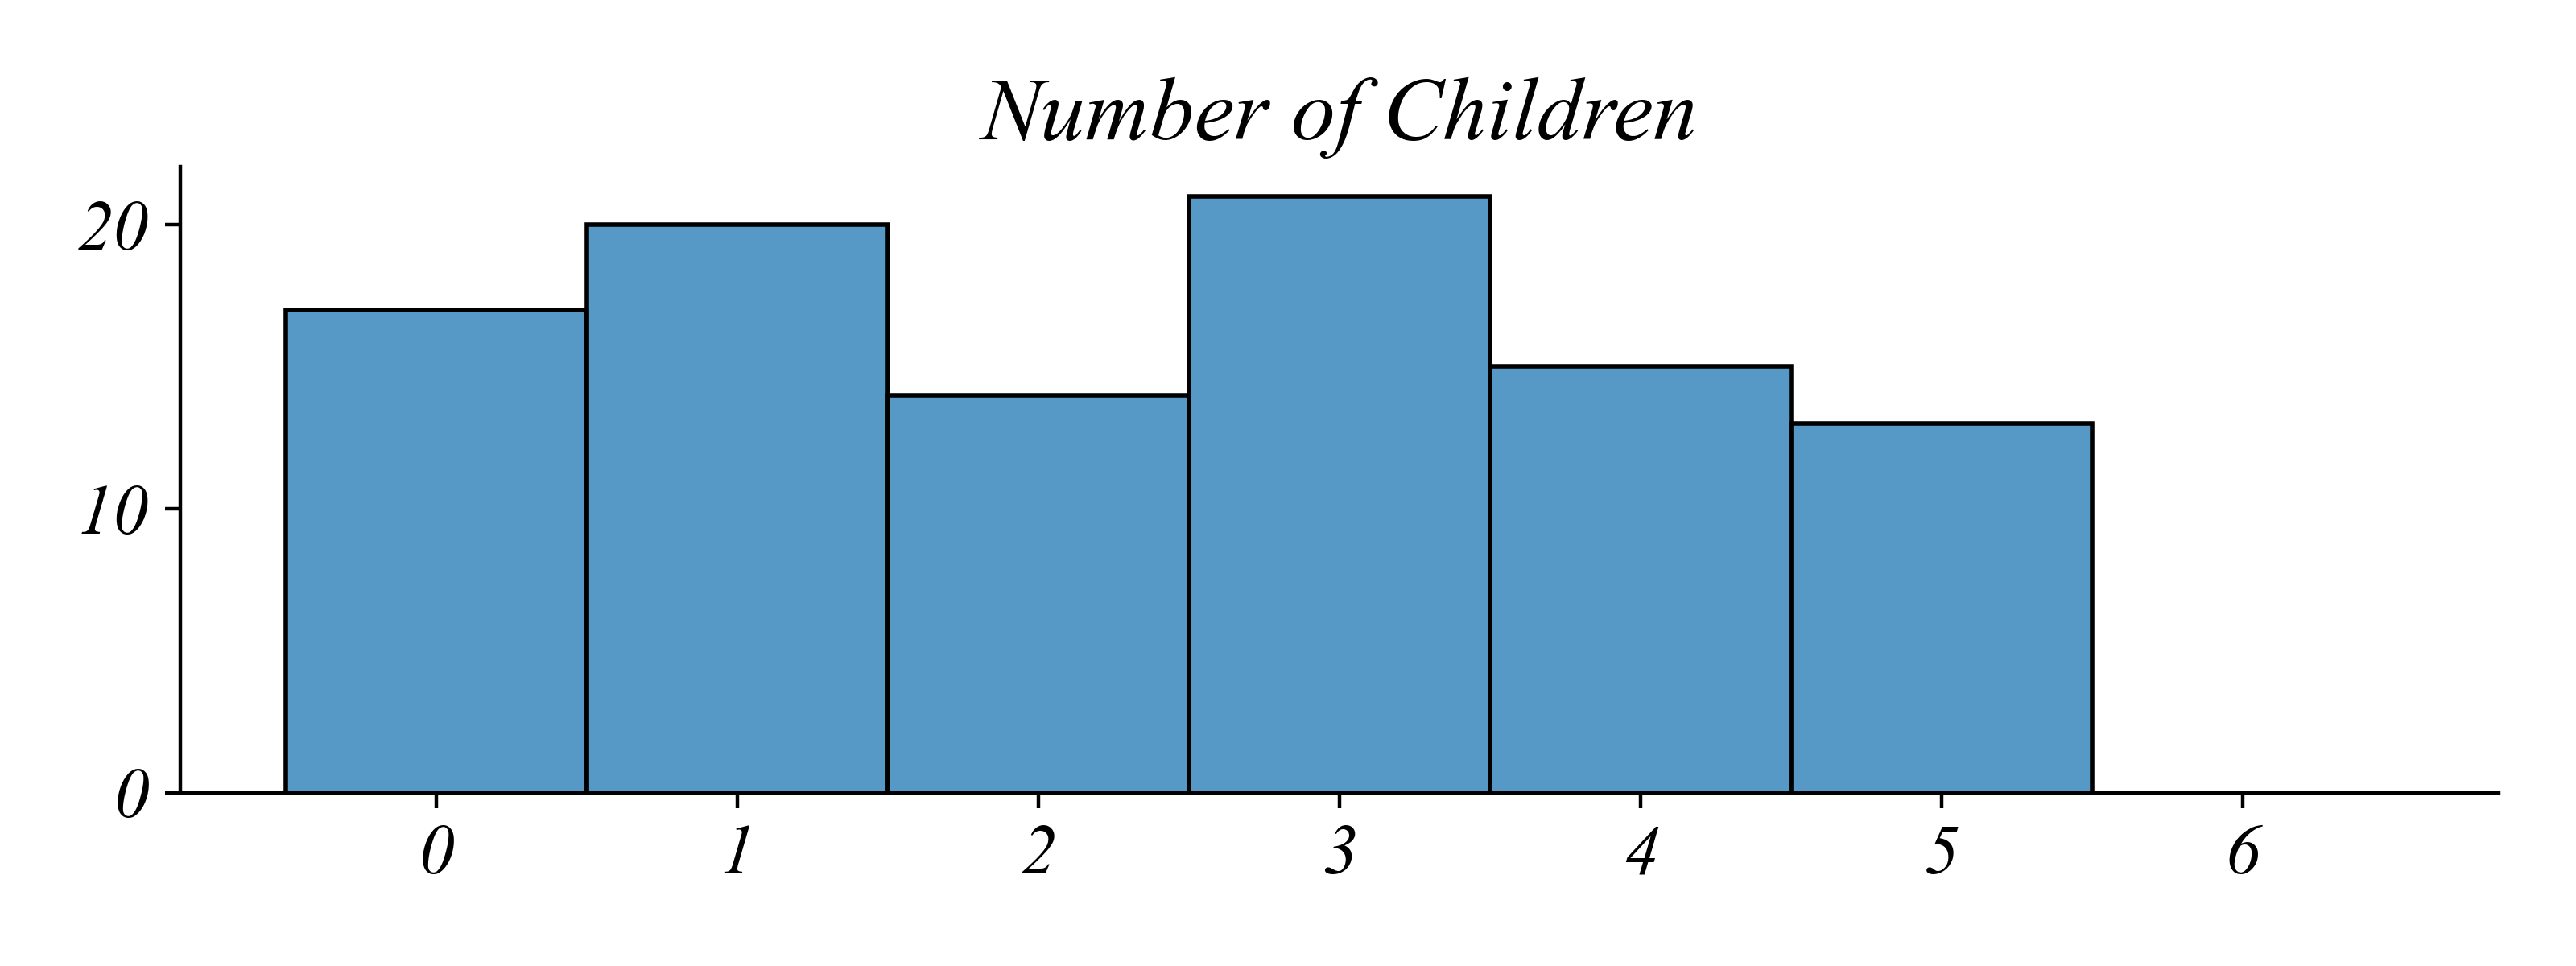
Exercise: Household Size
What type of variables are contained in household_size.csv?
Discrete Numerical: countable numbers with meaningful intervals (Number of Children in a Household)
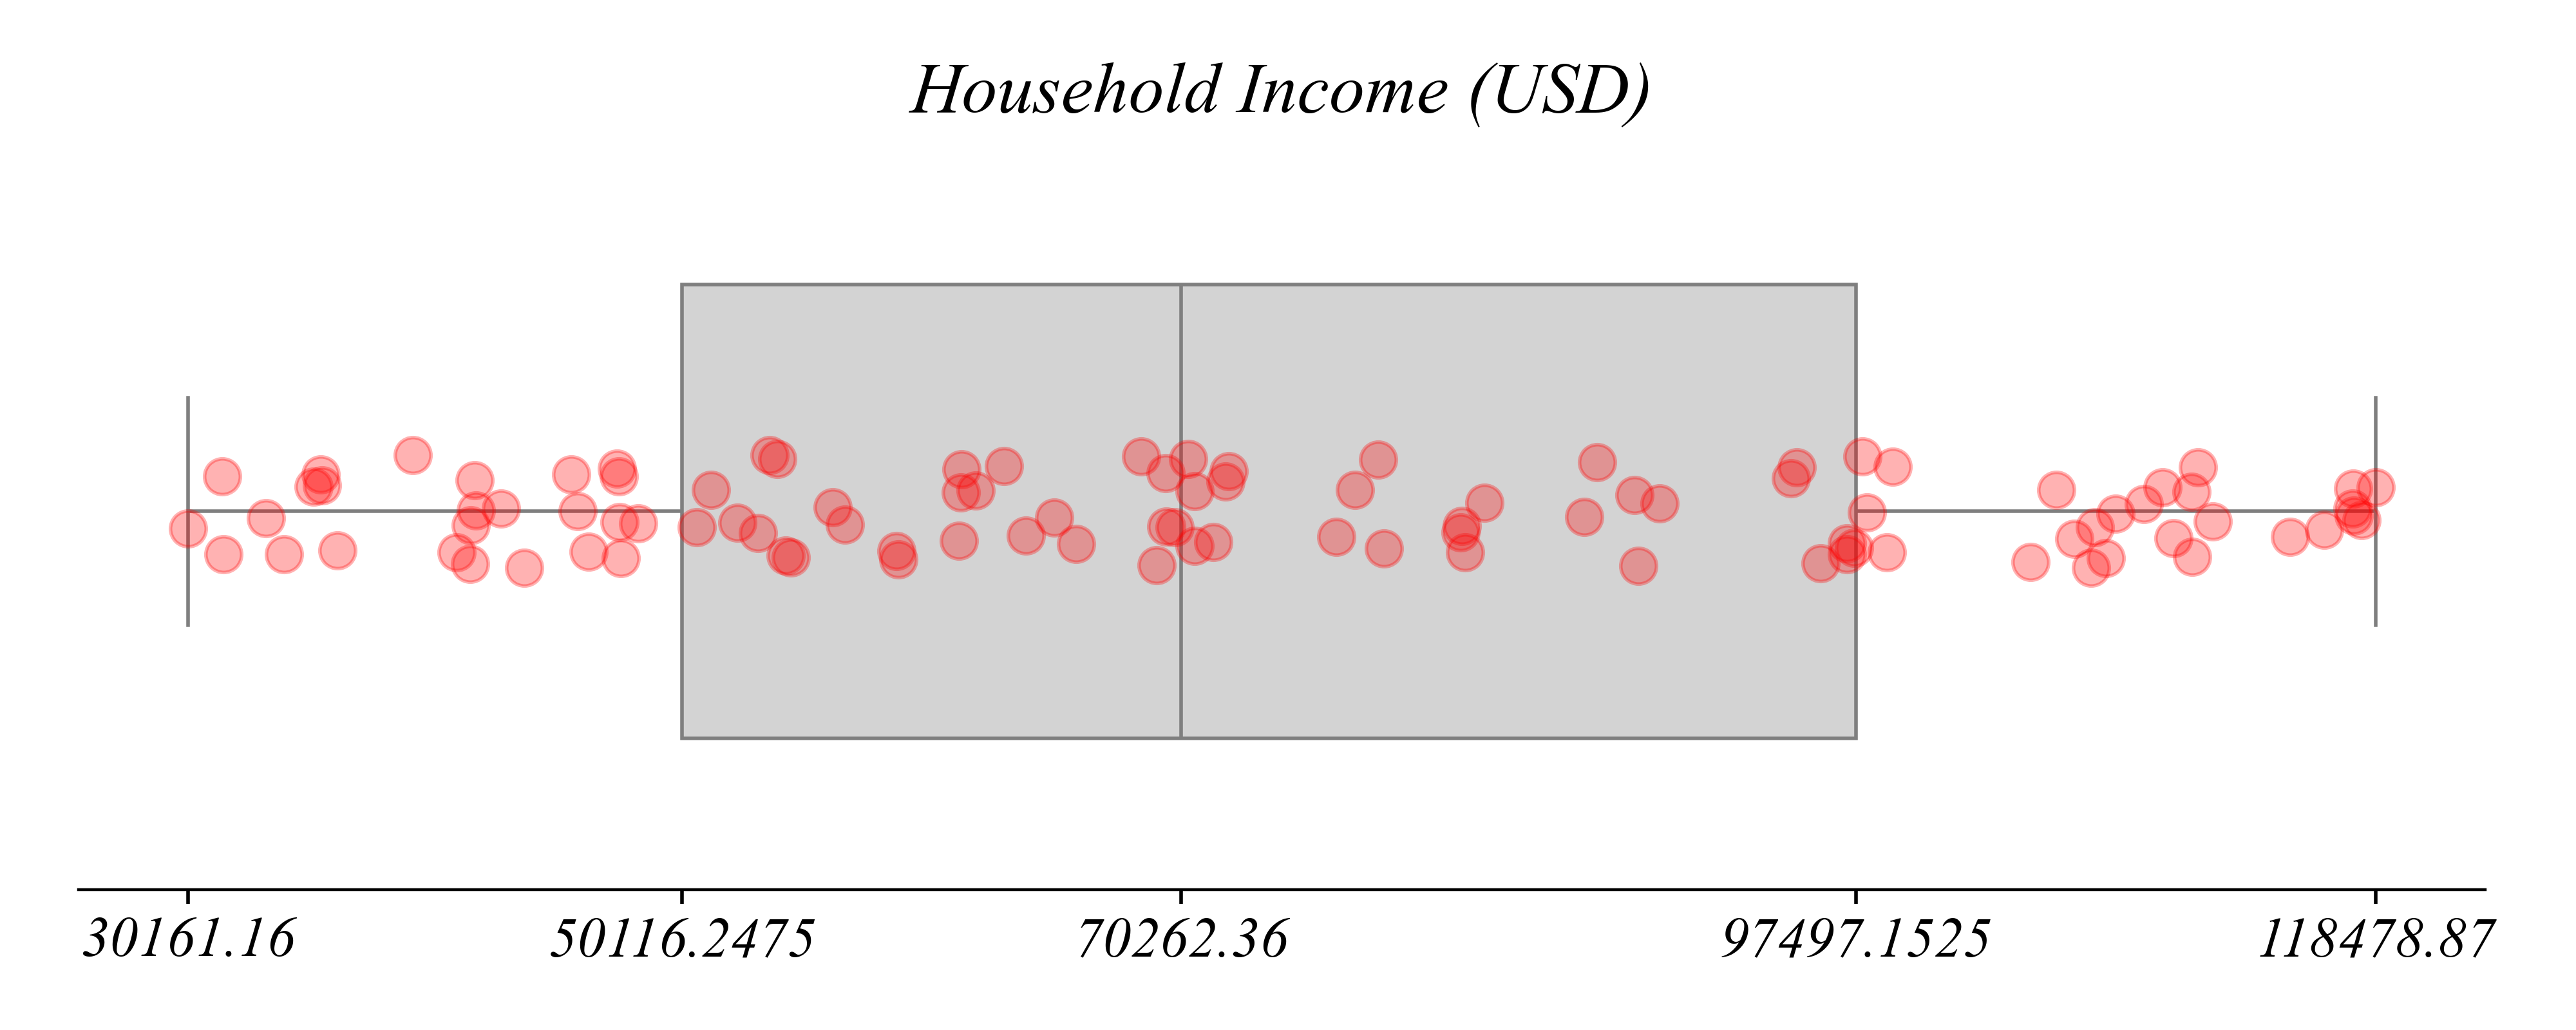
Exercise: Household Income
What type of variables are contained in household_income.csv?
Continuous Numerical: quantities measurable on the reals (Income in USD)