Part F | Buyers
// people respond to many interacting incentives //Part F completes our economic journey by revealing the elegant mathematics of human choice. After exploring how markets work and fail, we now discover how budget constraints and preferences create the demand curves that drive everything. You'll learn why consumers make the choices they do, how income from factor markets shapes purchasing power, and how utility maximization creates the predictable patterns we see in real markets. These insights don't just explain buyer behavior—they reveal the hidden logic behind every purchase decision you'll ever make.
Block F1 ~ Factor Markets
Factor markets determine the income that households earn from selling their labor and capital, which becomes the budget constraint for consumer choice.

Episode F1
Factor markets

Chapter 18: Factor markets Reading
Skim the text to understand the main ideas
Homework F1: Sunday December 8th Practice Assignment
Unlimited practice. Instant feedback. Submit to Gradescope.
Block F2 ~ Consumer Choice
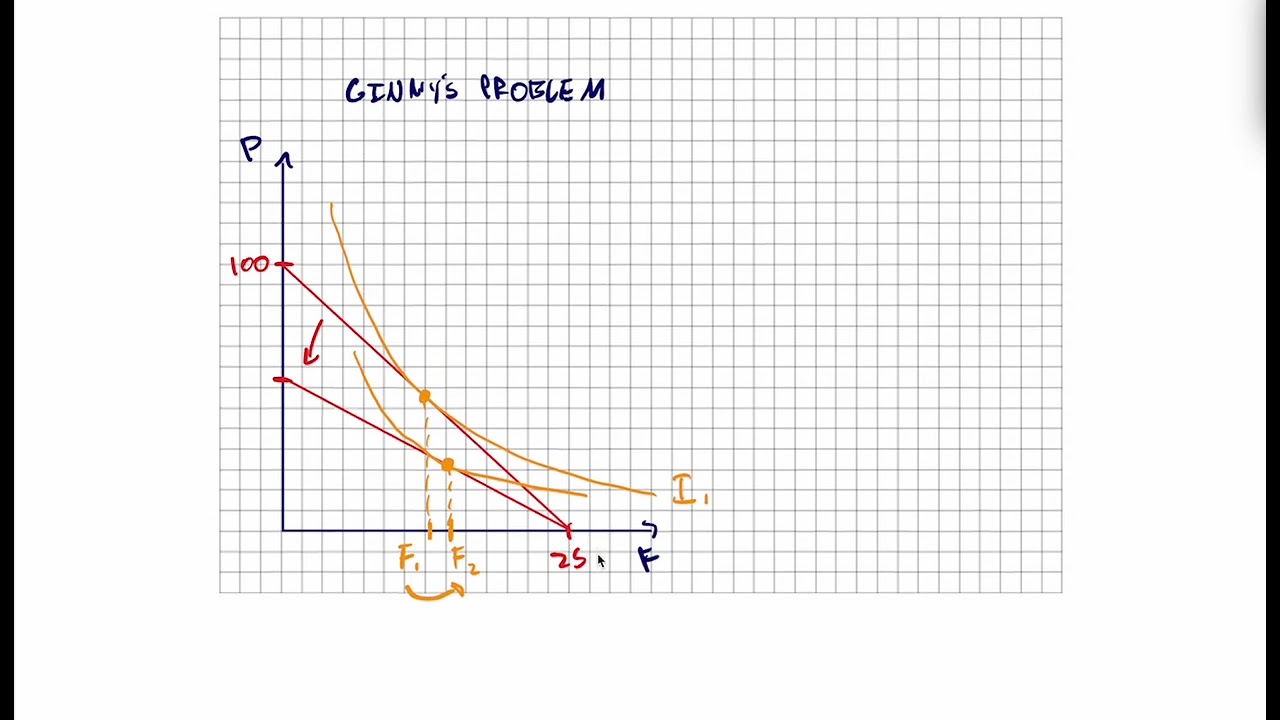
Given their budget constraint from factor markets, consumers maximize utility by choosing the optimal combination of goods where marginal utility per dollar is equal across all goods.
Episode F2
Consumer choice
Chapter 21: Consumer choice Reading
Skim the text to understand the main ideas

Homework F2: Due Date TBD Practice Assignment Solutions
Unlimited practice. Instant feedback. Submit to Gradescope.
Recitations
Come to Recitations prepared to work through extended Vignettes in both small groups and as a class. Your Recitation Instructor will guide you through a less structured economic problem, similar to what was covered in class and what you'll see on the next MiniExam. Submit your work to Gradescope at the end of Recitation.
Homework F Details
Homework F is due on Gradescope on Sunday December 8th.
Homework FAQs
Homework F Assignment
Some FAQs:
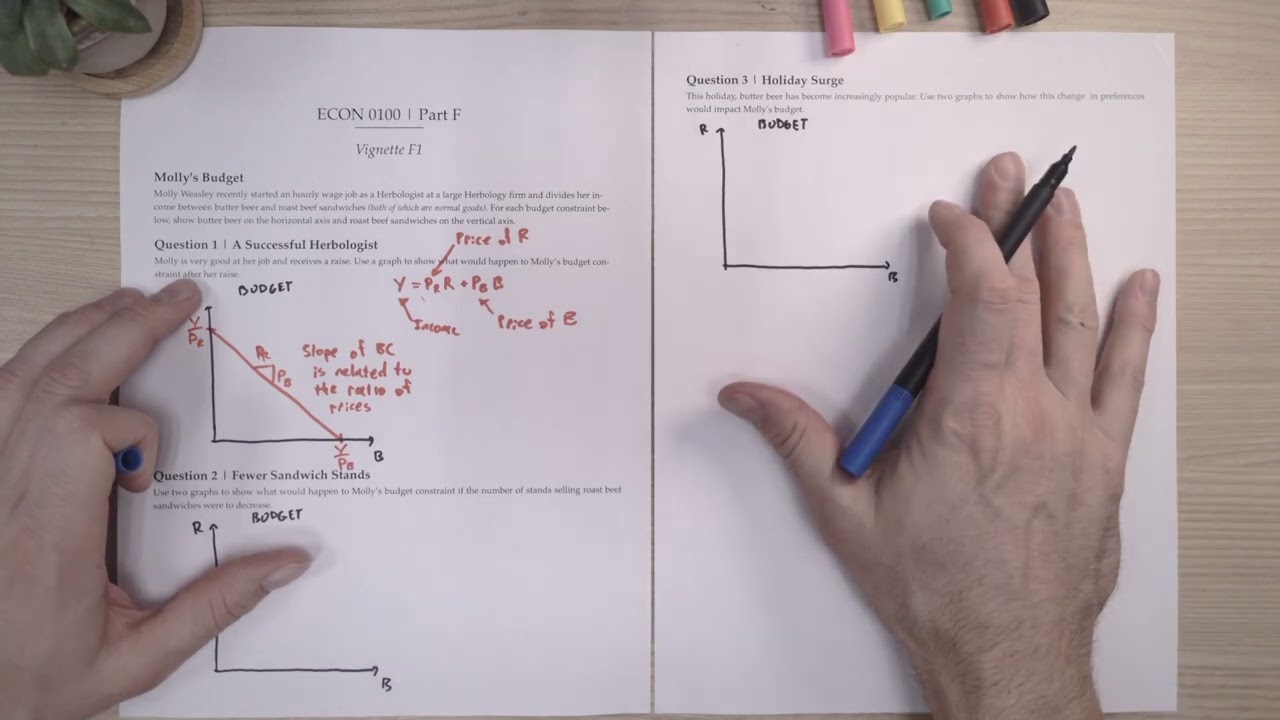
- In the graph for question 1, show Hagrid's initial budget constraint
- For question 2, in the graph below question 1, show Hagrid's optimal consumption bundle on the budget constraint they already drew (using indifference curves), then on the same graph, show how Hagrid's optimal consumption bundle would change using shifts in budget constraints and indifference curves.
- In the graph below question 3, show Hagrid's budget constraint from question 2, then show the shift in the budget constraint on the budget constraint for the same graph.
- Show the optimal consumption bundles (using indifference curves) on the budget constraints
MiniExams
MiniExam F will be held during finals week on Thursday December 12 at 2:00 PM if you're in the 10AM section or at 3:00 PM if you're in the 11AM section. MiniExam Z (comprehensive review) will be held after a 5 minute break. You will begin to learn that if you understand the concepts and do the work in the Vignettes, Homework, and Demo, you're going to be in good shape on the MiniExam.

Demo F1 is very similar to what you'll see on MiniExam F. Try solving first to catch your weak points. Then use the video and solutions to check your work. Note: this demo is a bit difficult so focus on Vignette F2.
Demo Z
Demo Z provides a comprehensive bird's eye view of everything we've learned this semester, connecting all the economic concepts from supply and demand through consumer choice.
Demo Z Demo
A bird's eye view of the semester - synthesizing all major economic concepts covered in Parts A through F